Home
Plant comparative metabolome database (PCMD) is a comprehensive multi-level comparison database encompassing intra- and cross-species metabolic profiling in 530 plants. The predicted metabolites provided in PCMD are mainly based on the Genome Scale Metabolism Model (GEM), which has been proven to be effective in predicting the presence of metabolites in organisms based on the genome (Mendoza, Olivier, Molenaar,&Teusink, 2019). PCMD contains 213,264 metabolites, 8,384 enzymes, 8,678 reactions, 30,669 experimentally-supported metabolites, 33,397 literature references. Moreover, PCMD also provides a range of user-friendly online tools, such as Species-comparison, Metabolites-enrichment, and ID conversion. The Species-comparison tool allows users to compare the specificity and commonness of metabolites between two different groups of plants at multiple taxonomic levels. The Metabolites-enrichment tool enables users to analyze the enrichment of metabolites. The ID conversion tool allows for efficient conversion of metabolite IDs across multiple published metabolomics databases.

Search species
The “Search species” module provides metabolite information of 530 species in PCMD. The following tutorial video will provide a comprehensive overview of this page.
Alternatively, users can explore the tutorial below to learn about the functionality of this page.
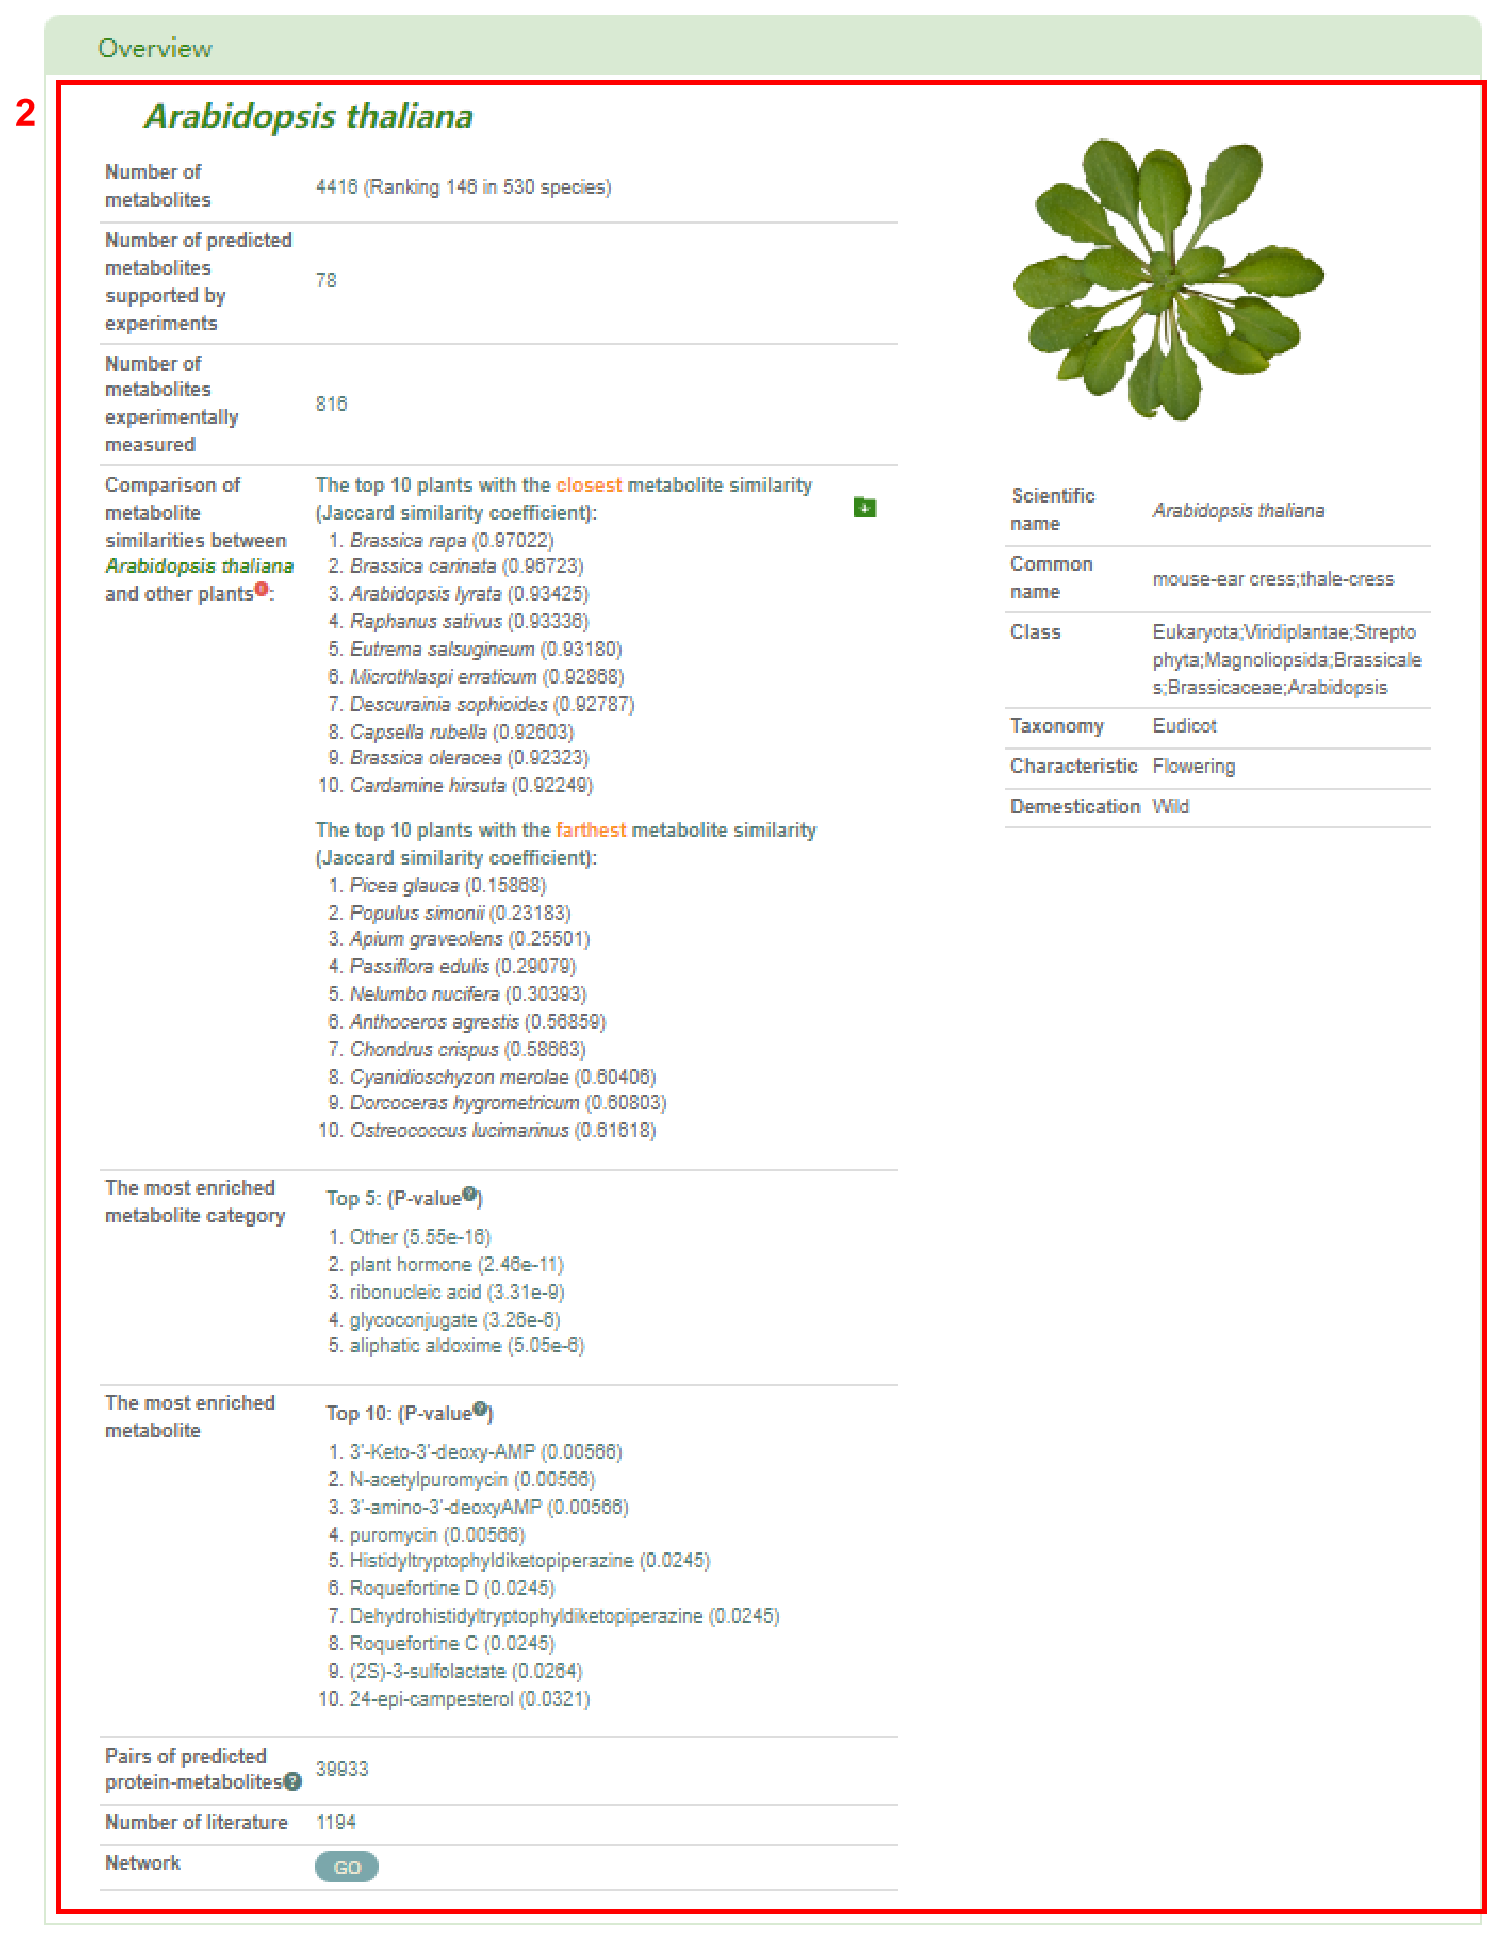
In this page, users can enter scientific name, abbreviation, or common name of the interested species to get the related information. For example, if users enter ‘Arabidopsis thaliana’ in box 1, results in boxes 2 to 15 will be obtained.

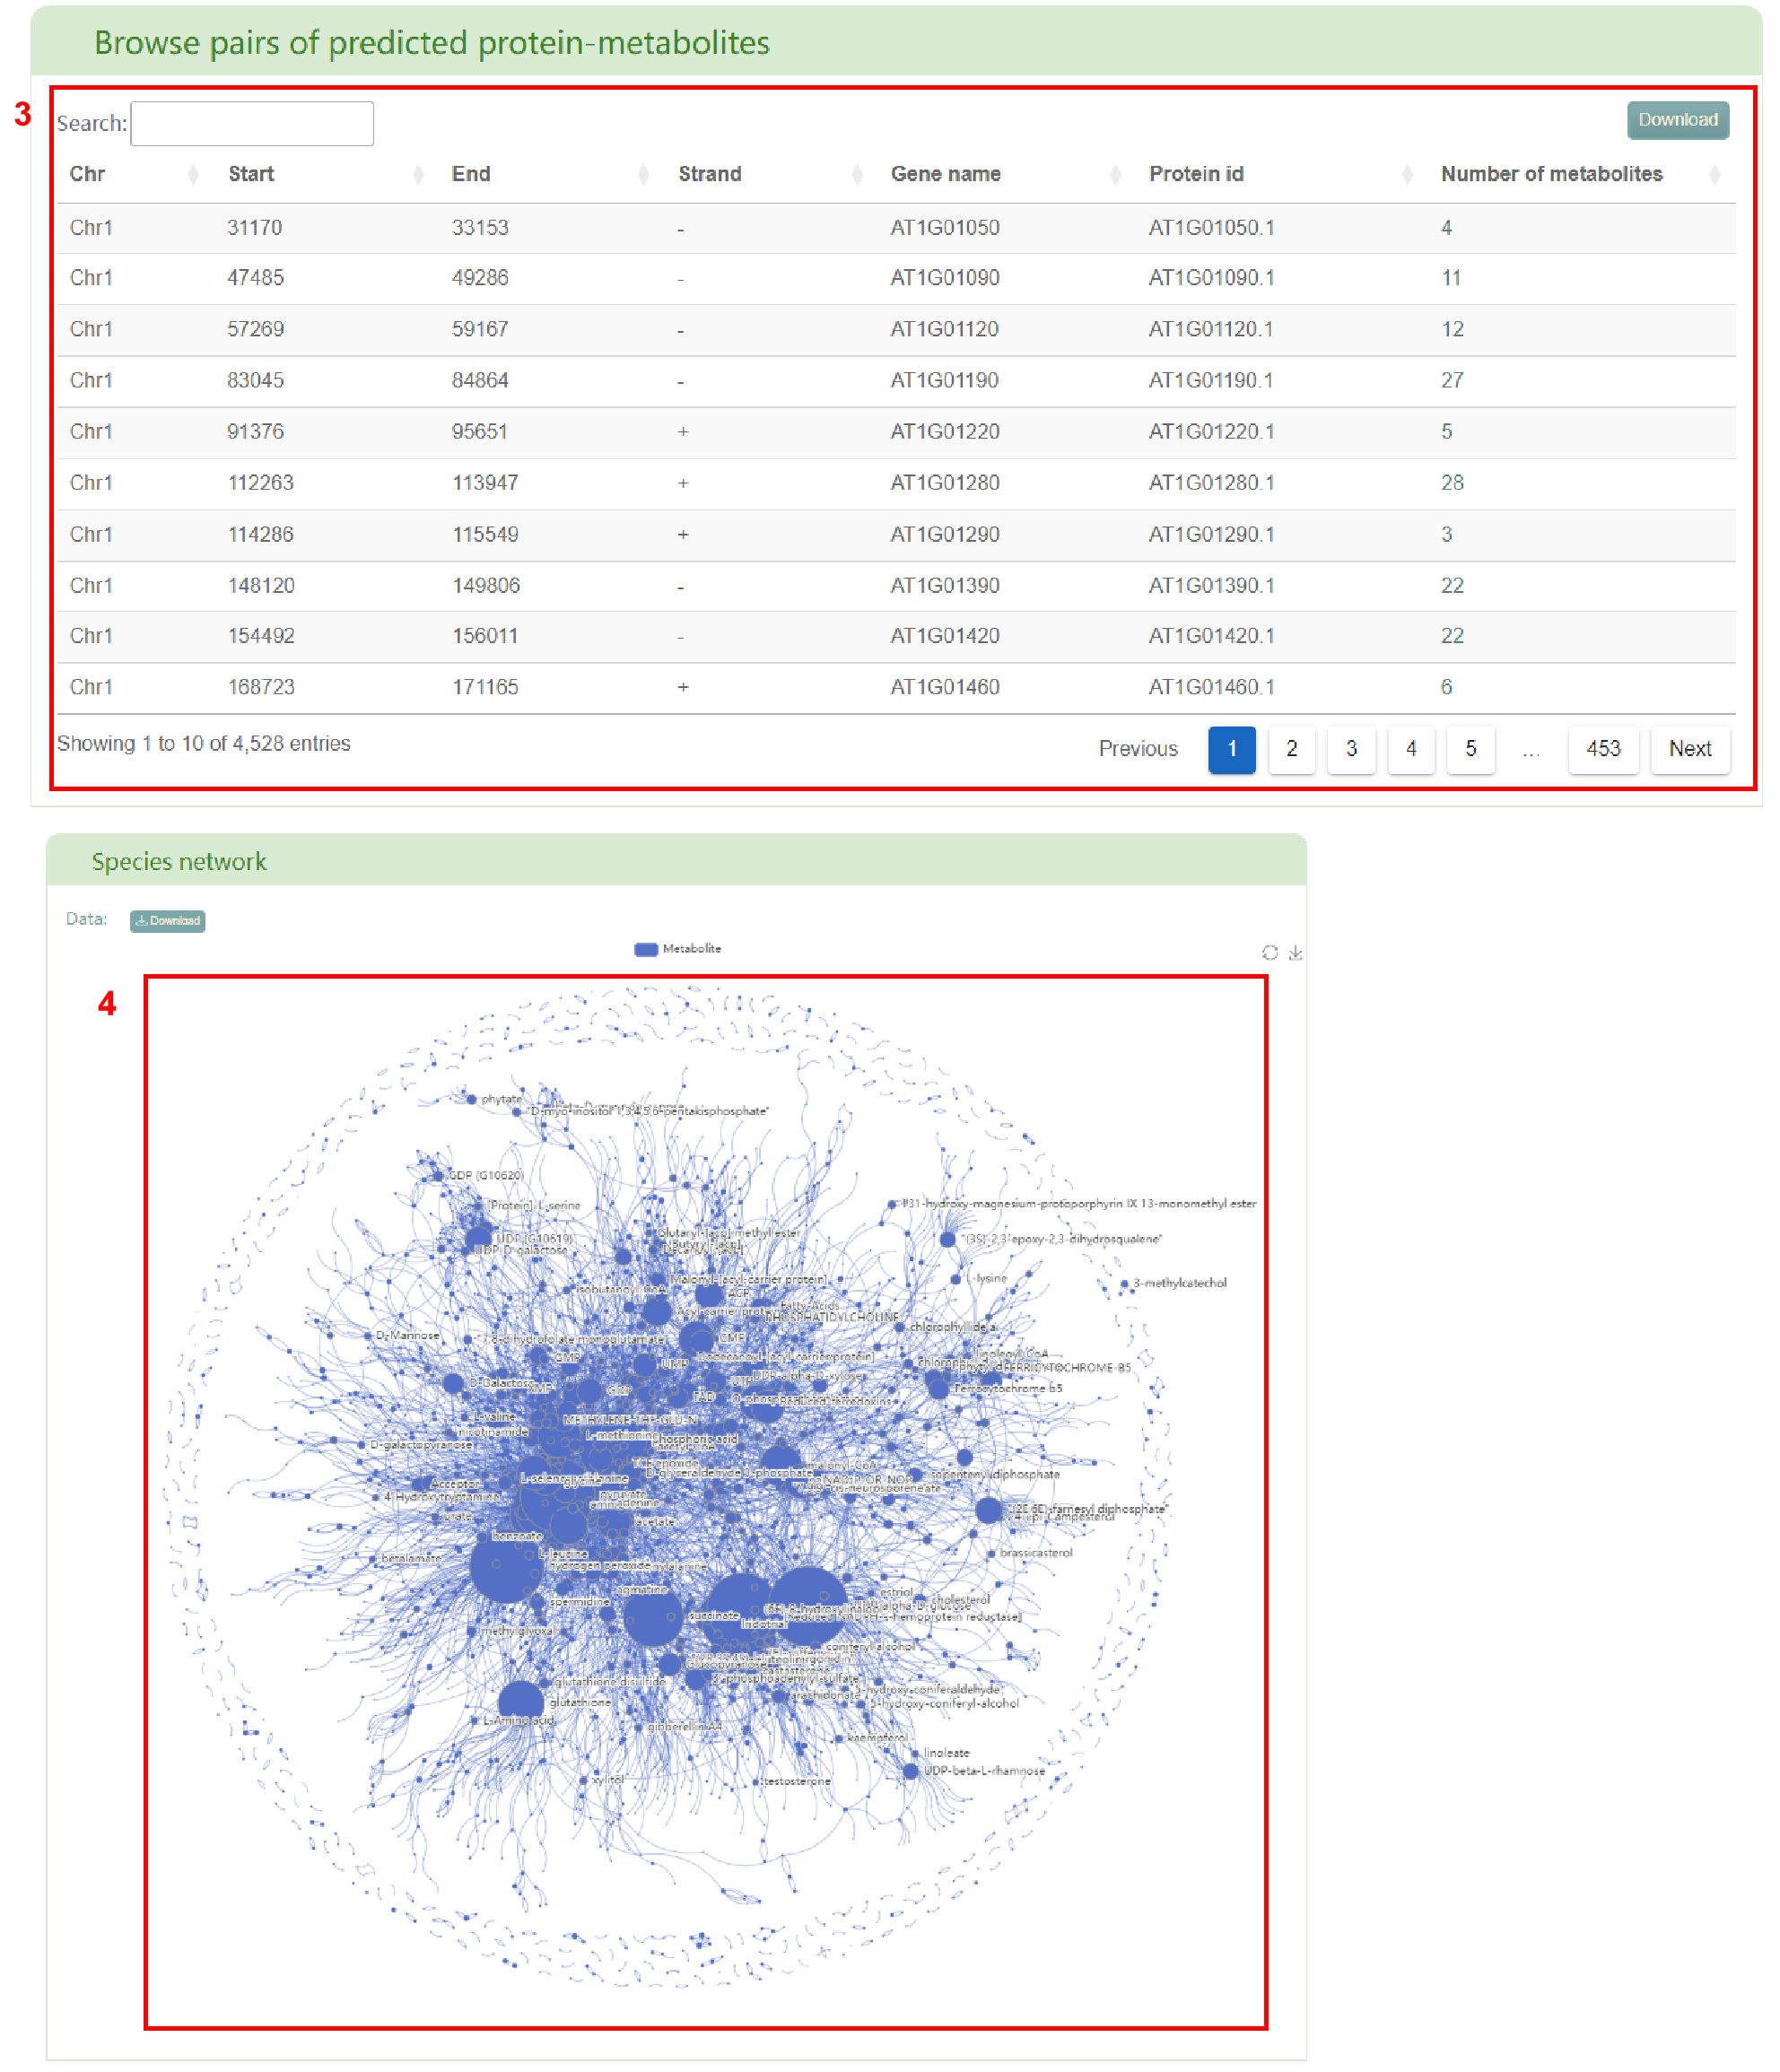
Firstly, box 2 provides an overview of the entered species, including information such as the number and ranking of metabolites, the number of predicted metabolites supported by experiments and metabolites experimentally measured, the top 10 plants with the closest and farthest metabolite similarity in PCMD, the top 5 enriched metabolite categories, the top 10 enriched metabolites, the pairs of predicted protein-metabolites, related literature, and the metabolic network. User can get a table of the genes associated with metabolites in the entered species (box 3) by clicking on the number of predicted protein-metabolite pairs. Clicking the “Go” button obtain the metabolic network of the entered species (box 4).
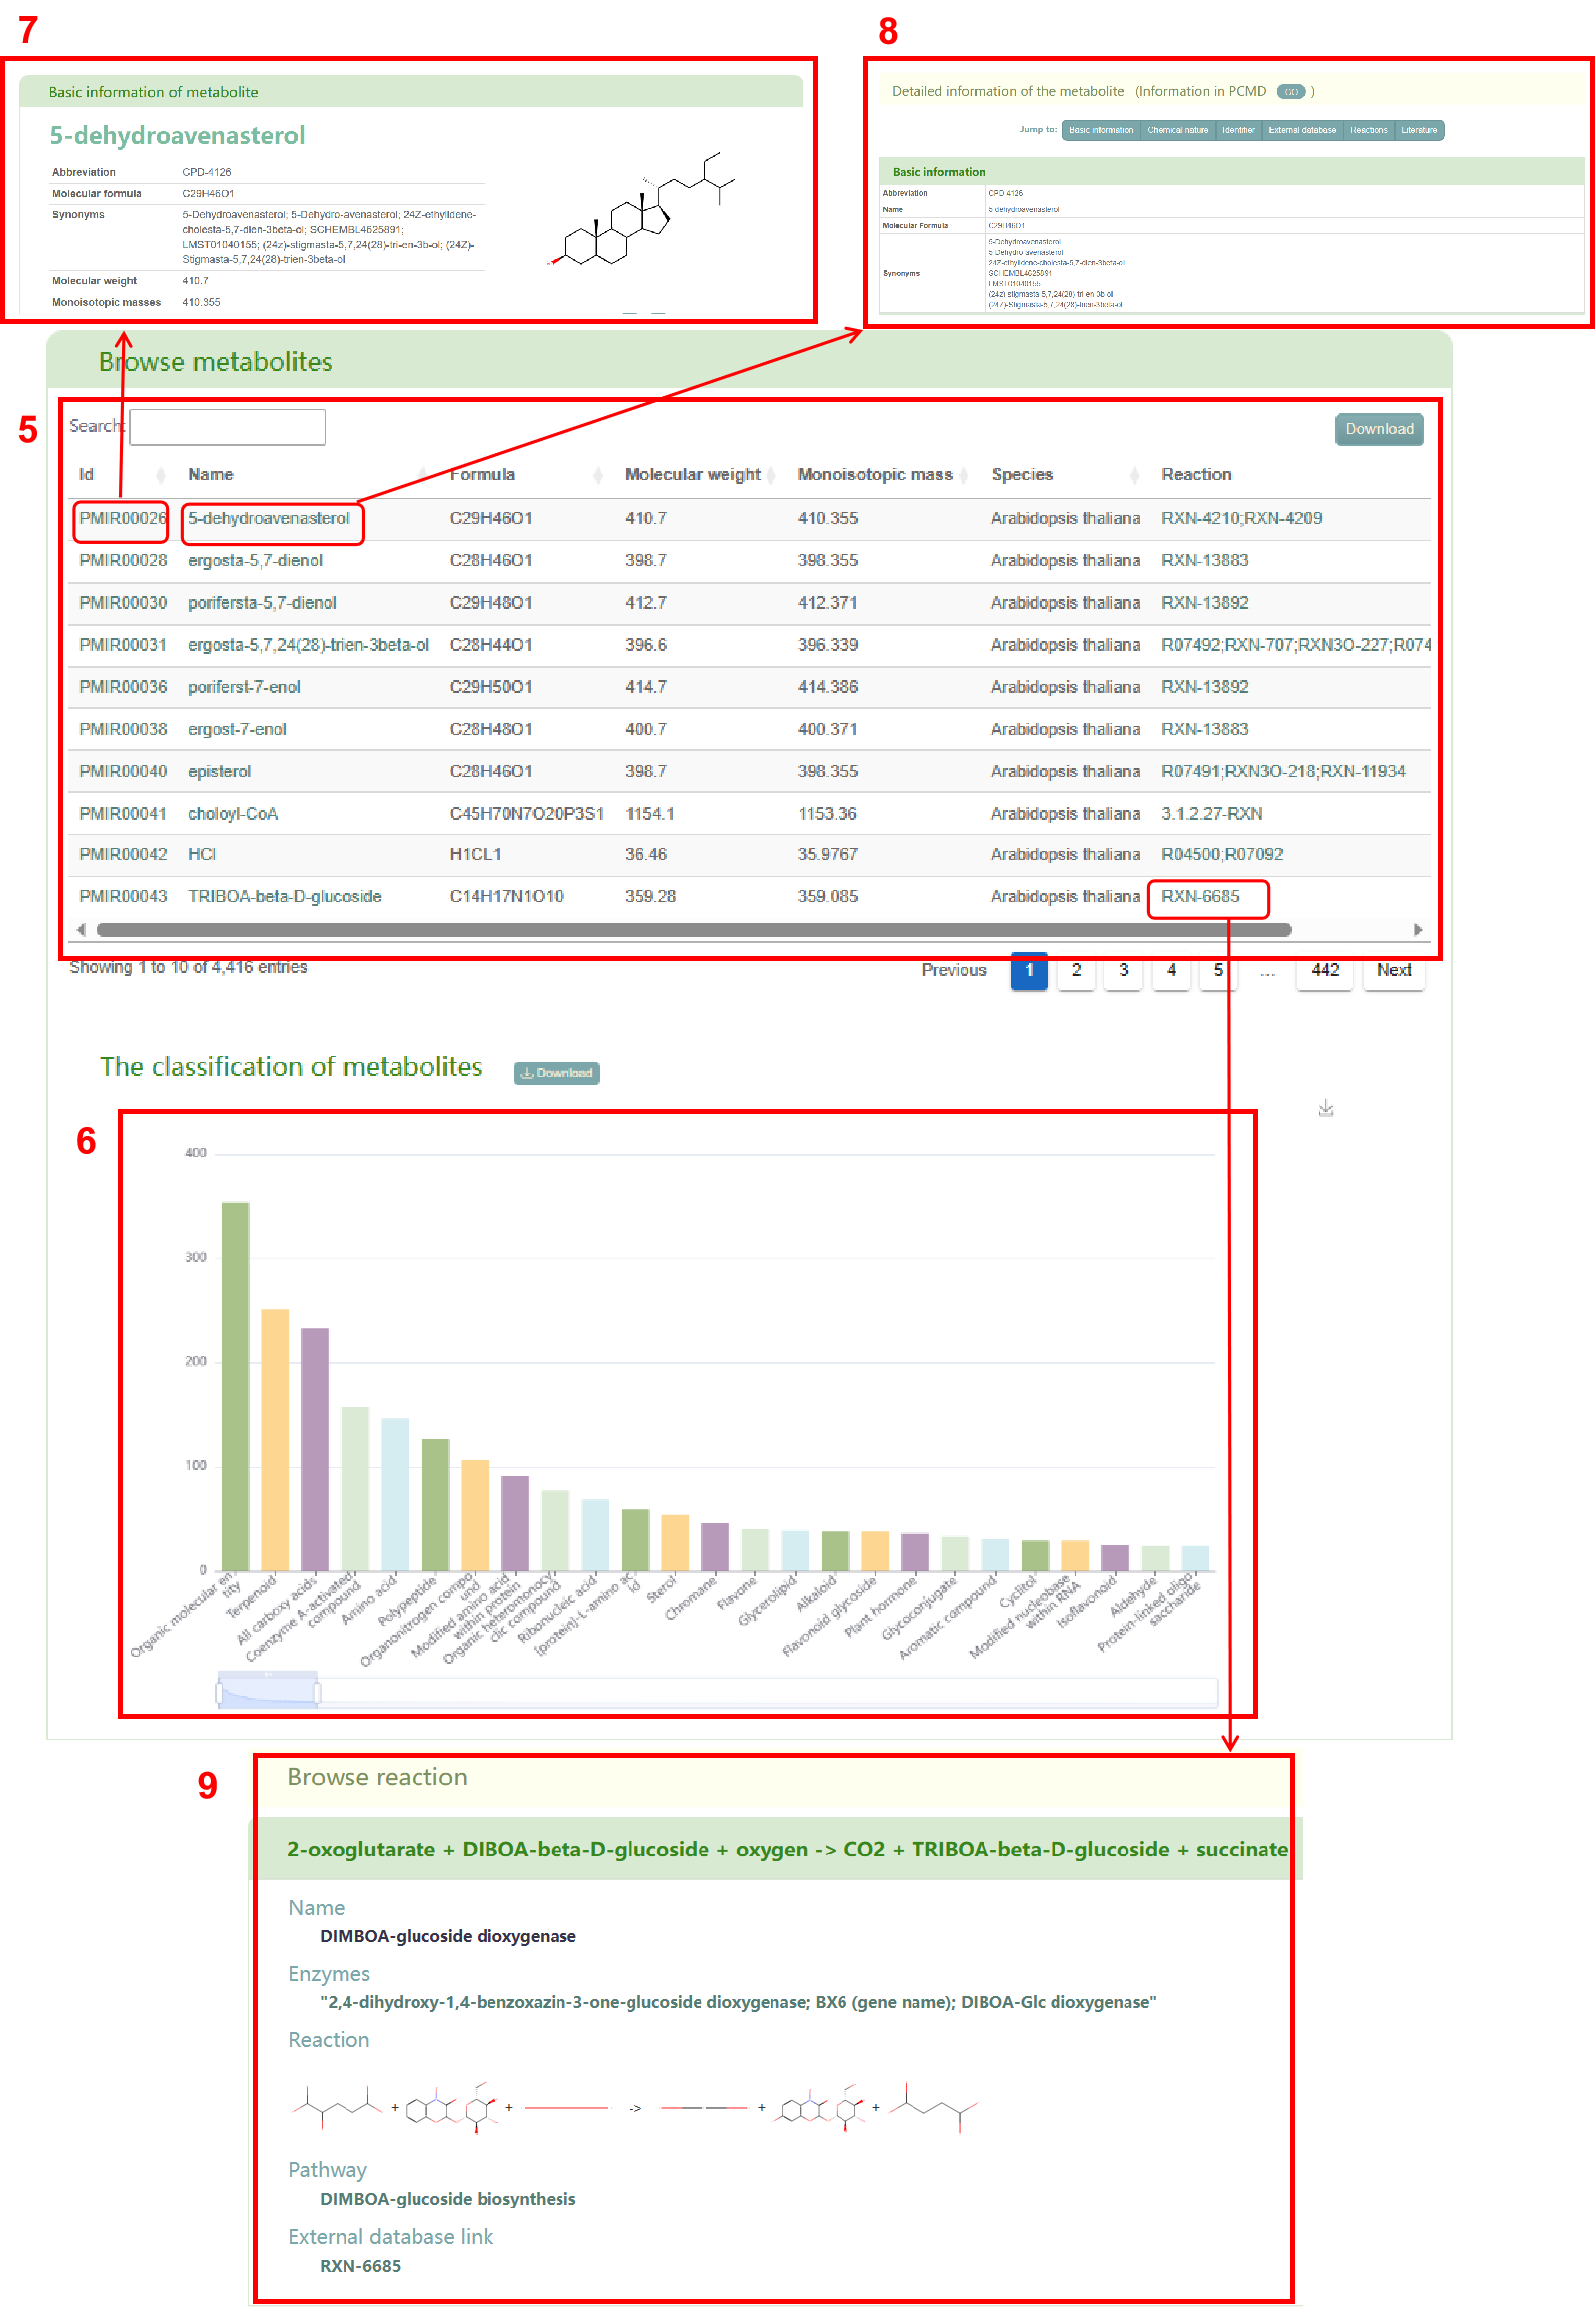
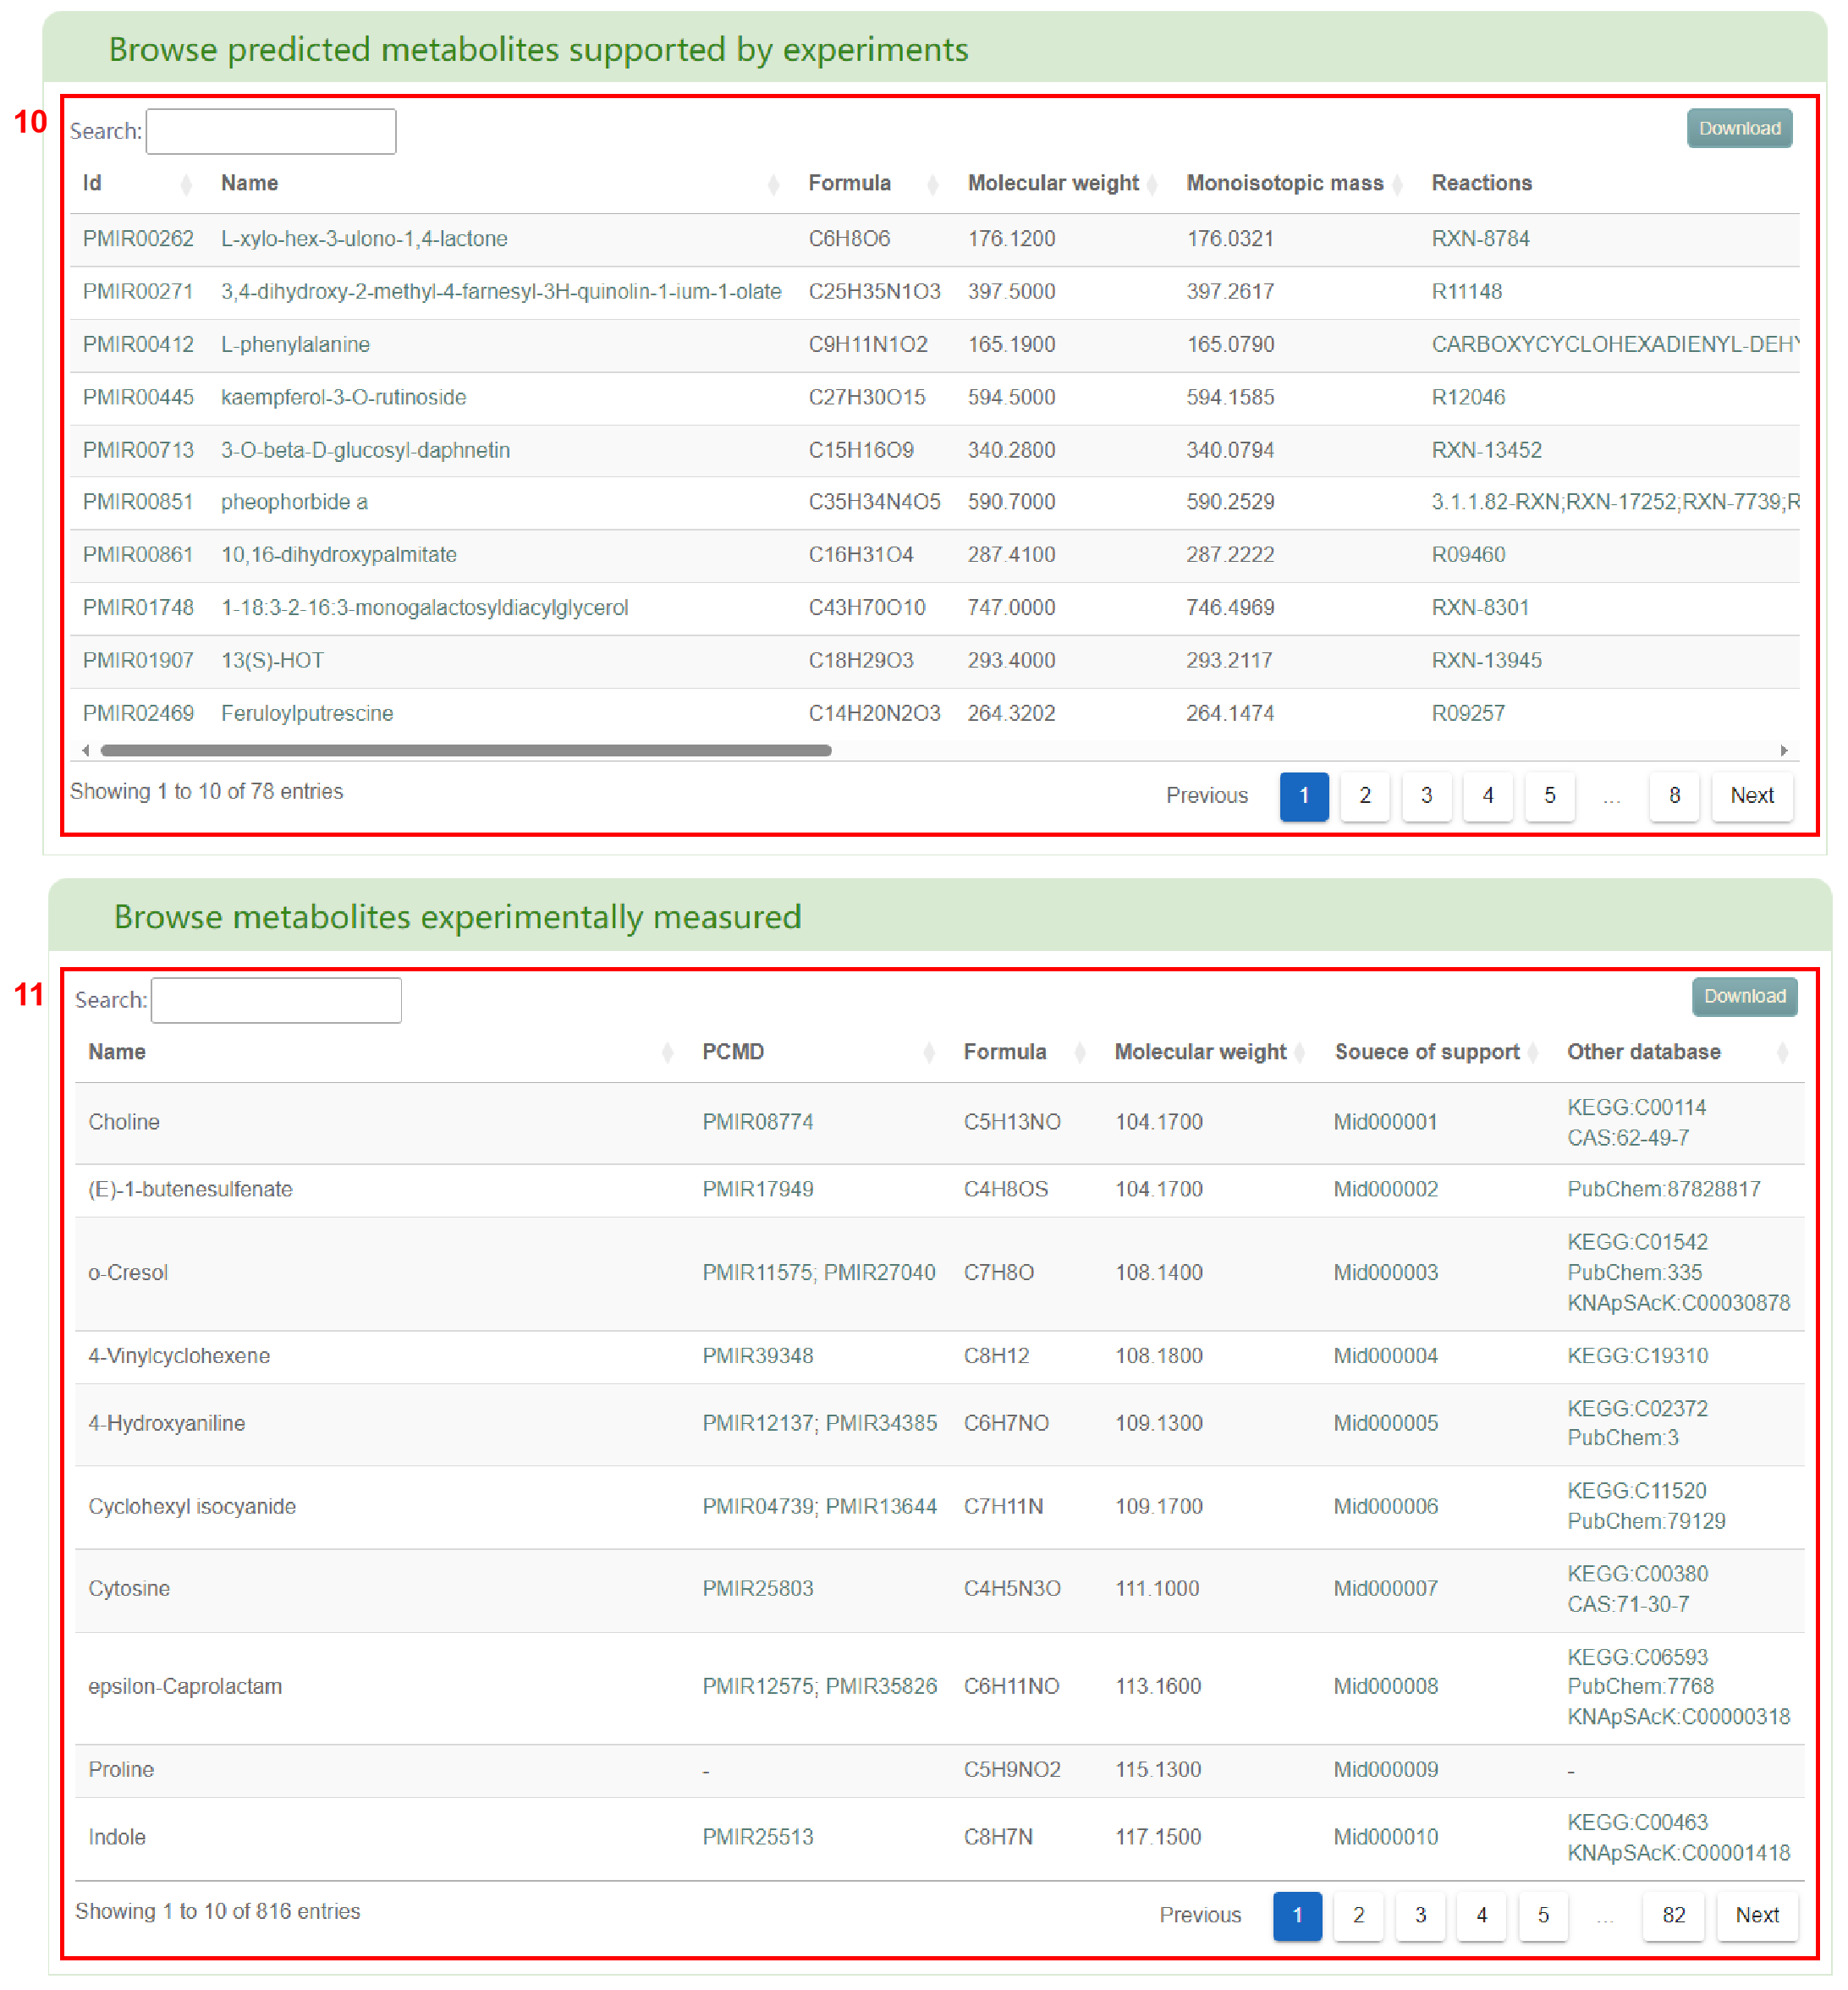
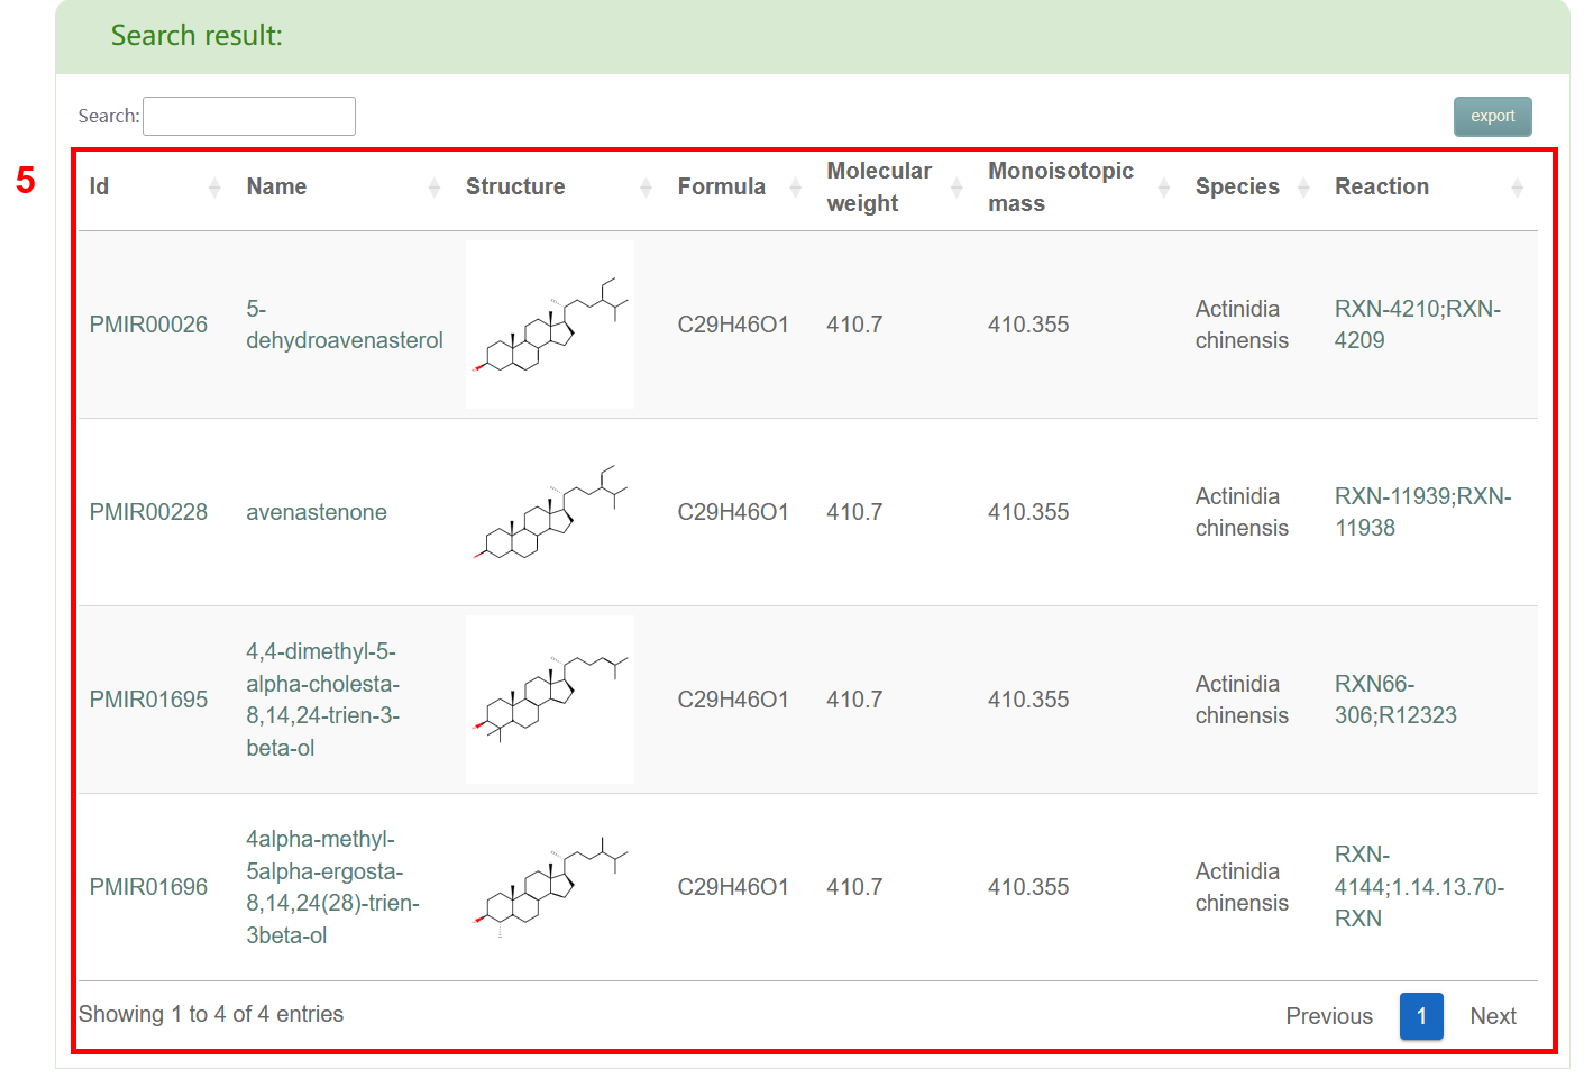
Secondly, users will obtain a basic information table of metabolites in the entered species (box 5) and a bar chart of metabolite classification (box 6). By clicking the metabolite ID, users can access the corresponding metabolite page in PCMD (box 7) and gather detailed information on the metabolite (box 8), accessed by clicking the metabolite name. Additionally, users can click on the reaction to access the related details page (box 9) for that specific reaction. Furthermore, users can access the basic information table of predicted metabolites supported by experiments (box 10) and metabolites experimentally measured (box 11) in the entered species. Sources of experimental support for the metabolites are also shown in the table.
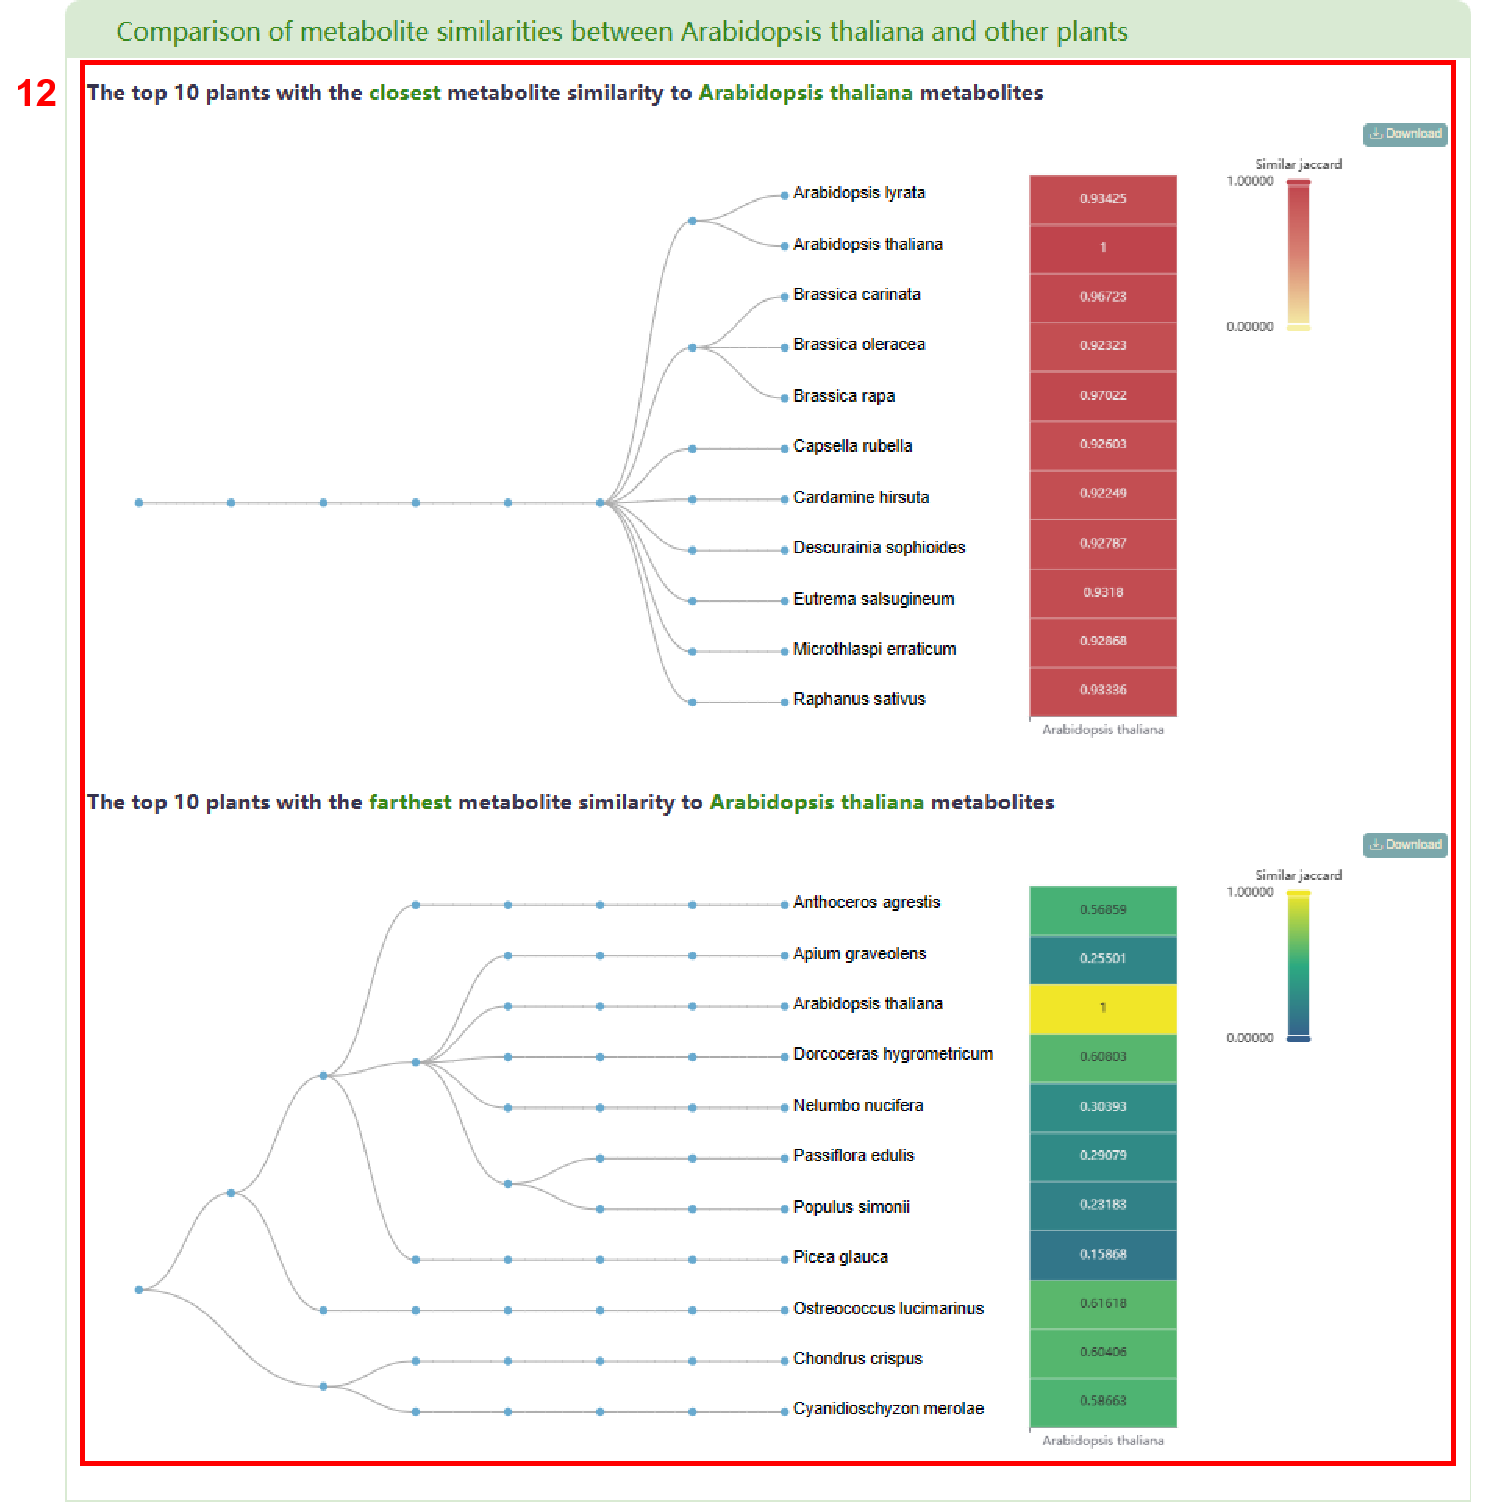
Next, a visualization is provided that compares the metabolite similarity between the entered species and other plants. The result primarily display the top 10 plants with the highest and lowest metabolite similarities in PCMD (box 12).
In addition, users can obtain the enrichment of metabolite categories in the entered species (box 13) and view the metabolites belonging to a specific category, such as ‘plant hormone’ (box 14). Finally, users can access a list of literature related to their search in box 15.


Species-comparison
The “Species-comparison” module allows users to compare the specificity and commonness of metabolites between two different groups of plants at multiple taxonomic levels. Next, this video will introduce the usage of this page.
Alternatively, users can explore the tutorial below to learn about the functionality of this page.
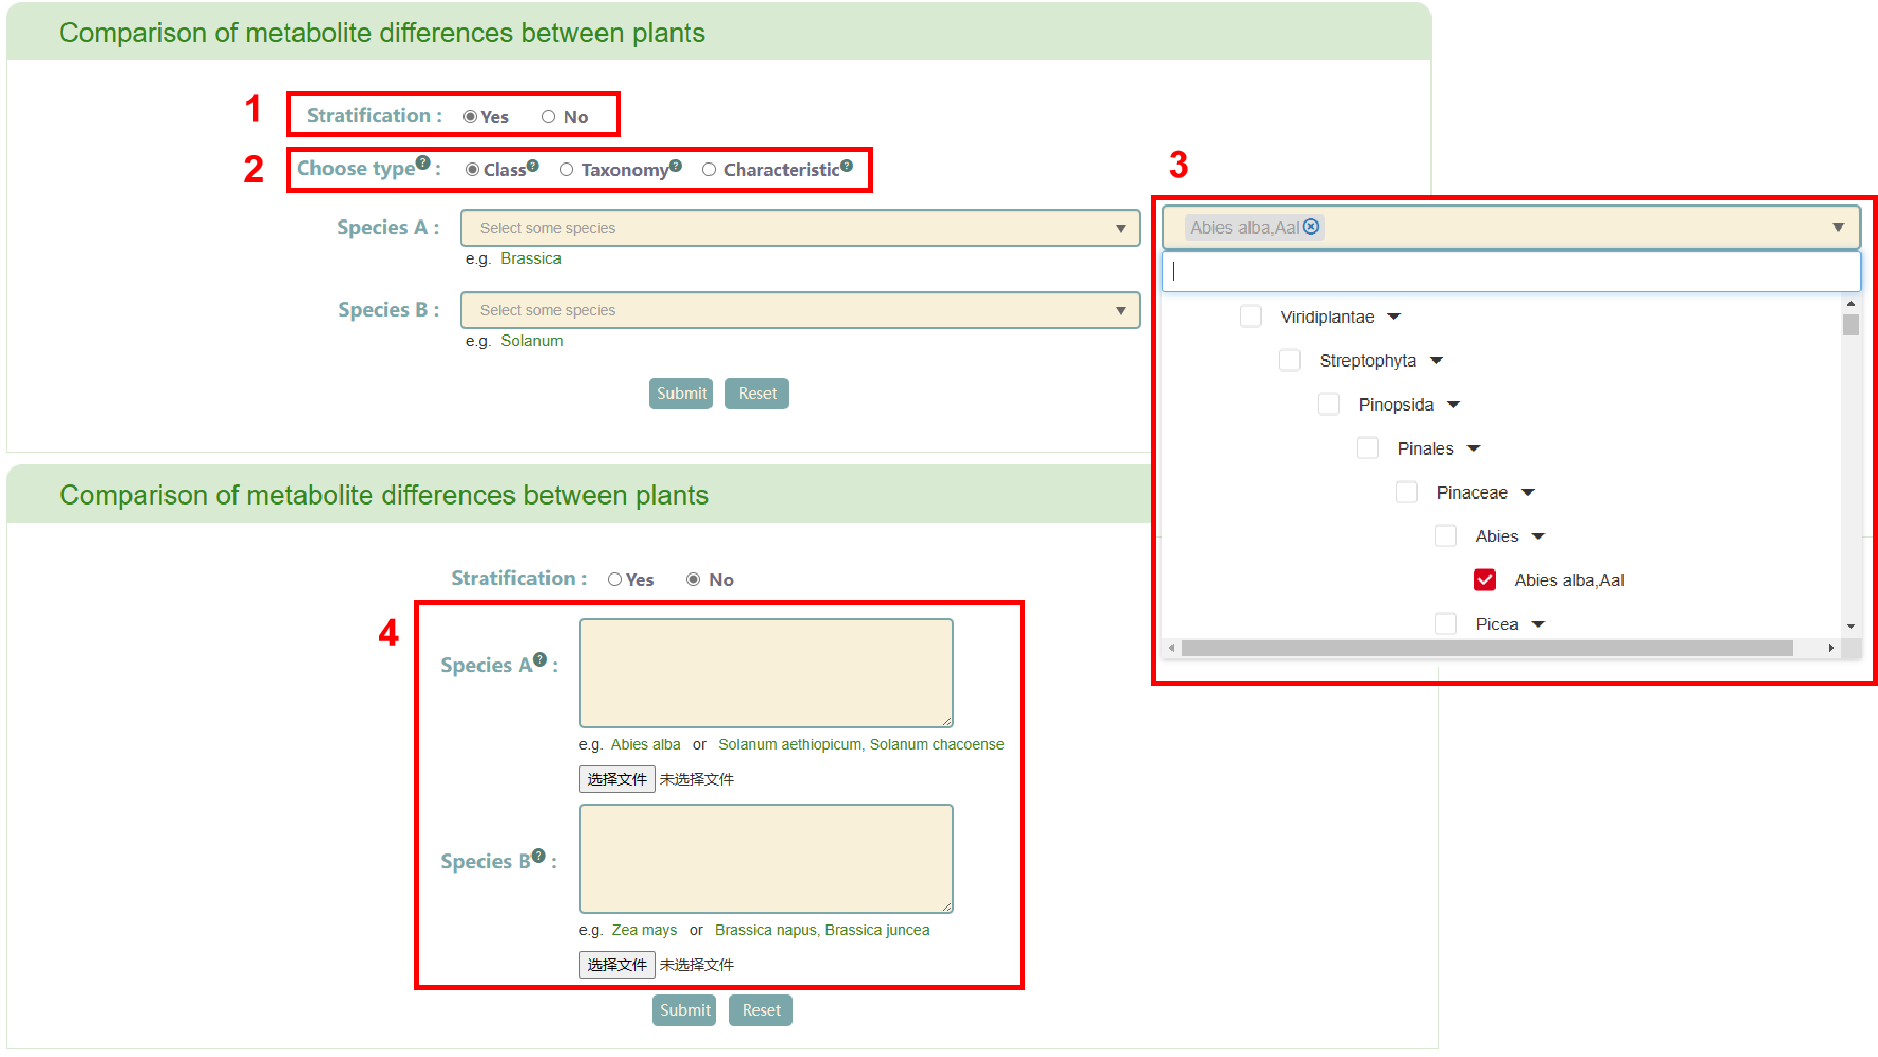
In this page, users can select whether to enter species by stratification (box 1). If users choose “Yes”, PCMD offers three classification types: "Class", "Taxonomy", and "Characteristic" (box 2). Users can select plants according to family by choosing “Class”, monocotyledonous, wild or domesticated types by selecting “Taxonomy”, and flowering and non-flowering classifications by selecting “Characteristic”. Users can enter two different groups of species based on the corresponding classification criteria (box 3). Alternatively, if users choose “No” in the stratification, they can freely enter or upload two different groups of species, provided the species are among the 530 species in PCMD (box 4). After entering the species, users click the “Submit” button to obtain the related information.
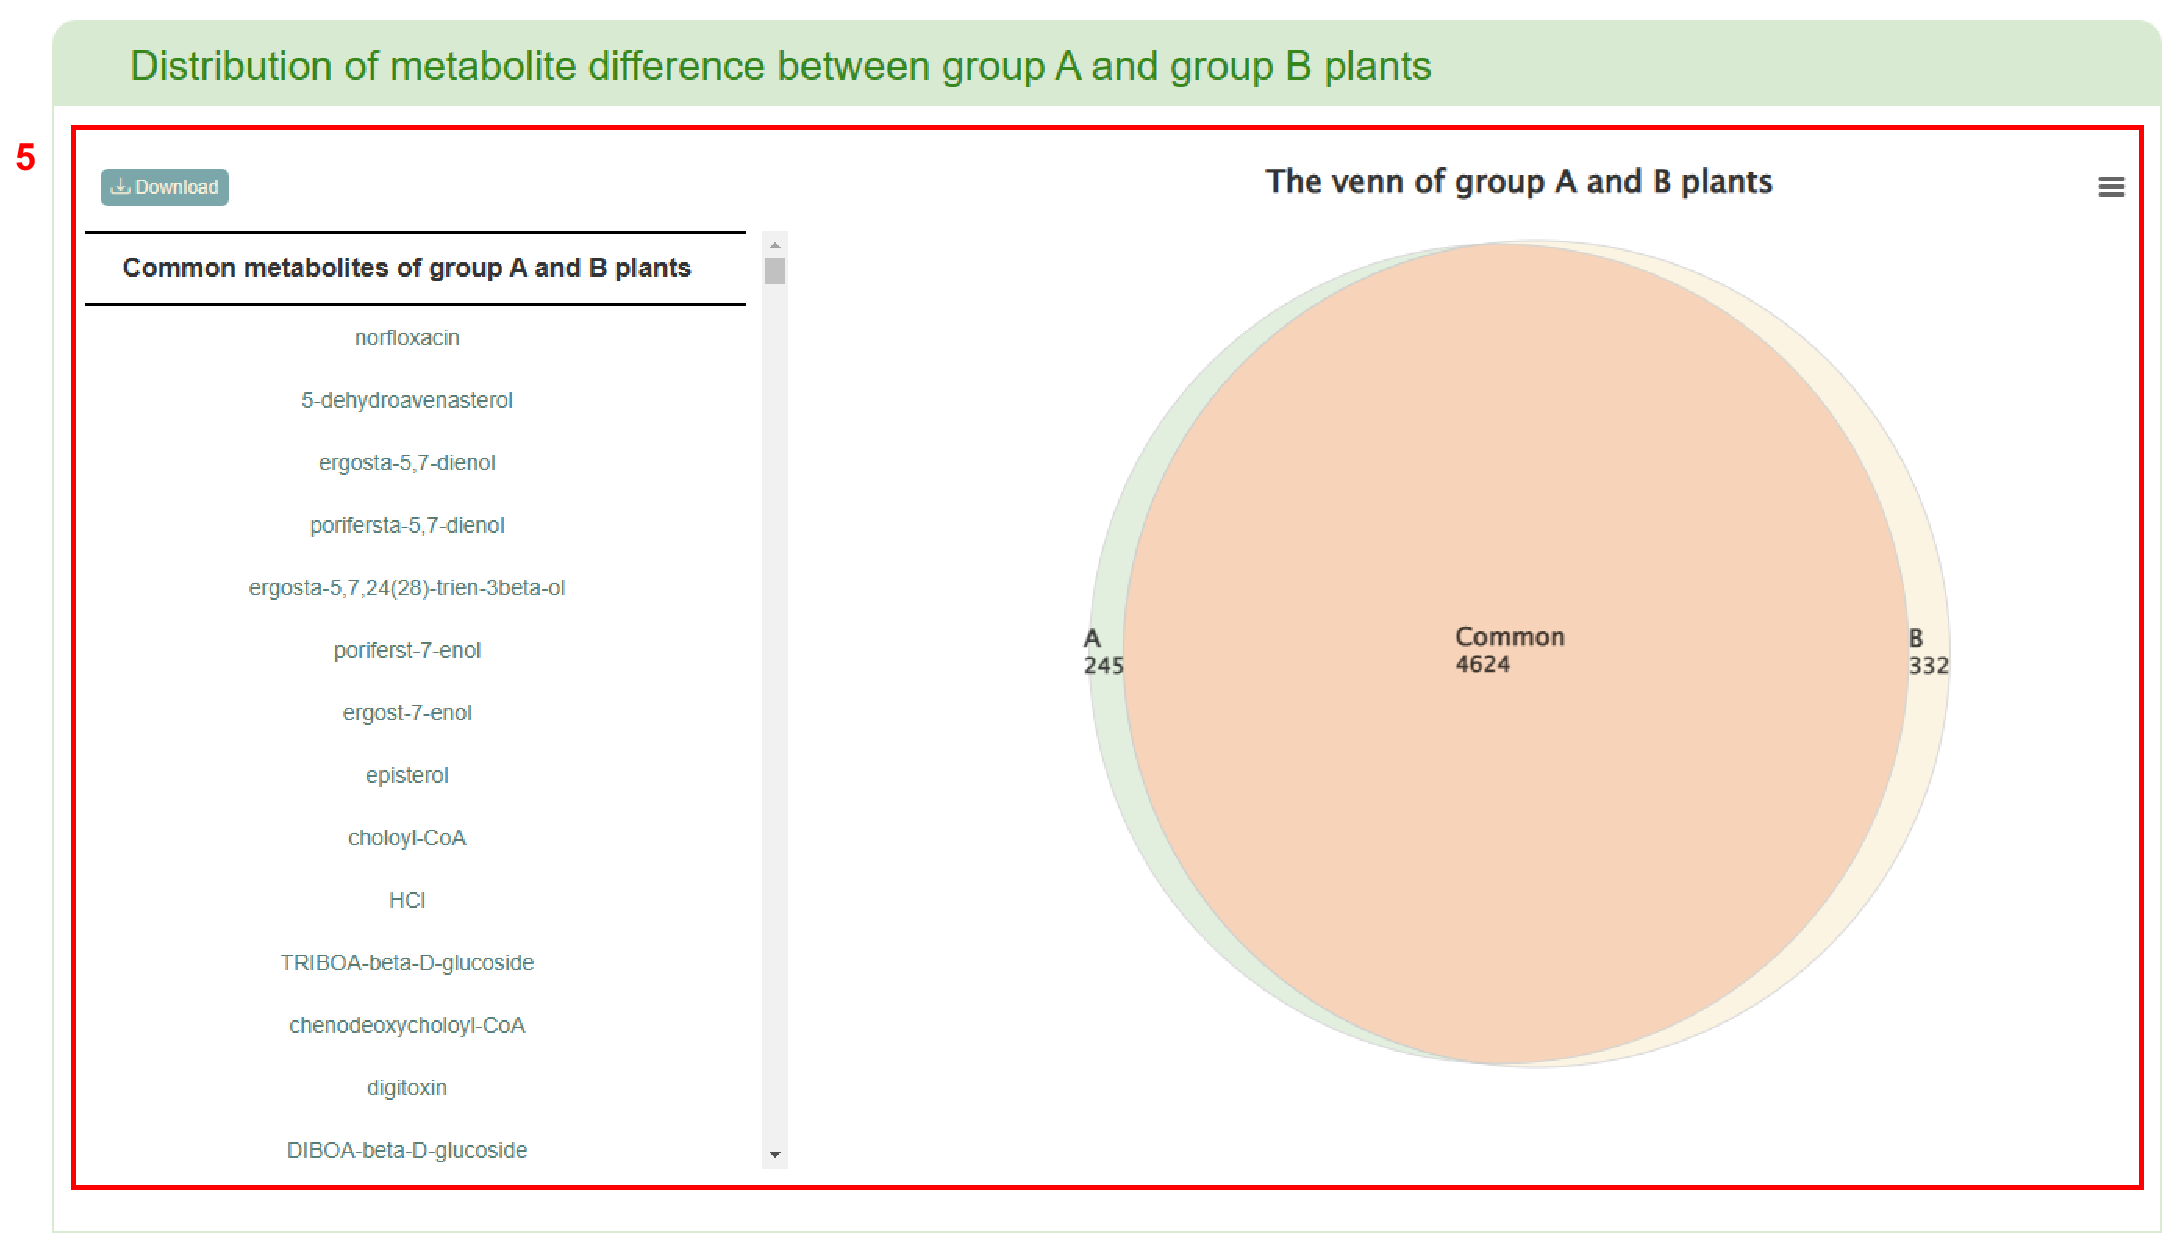
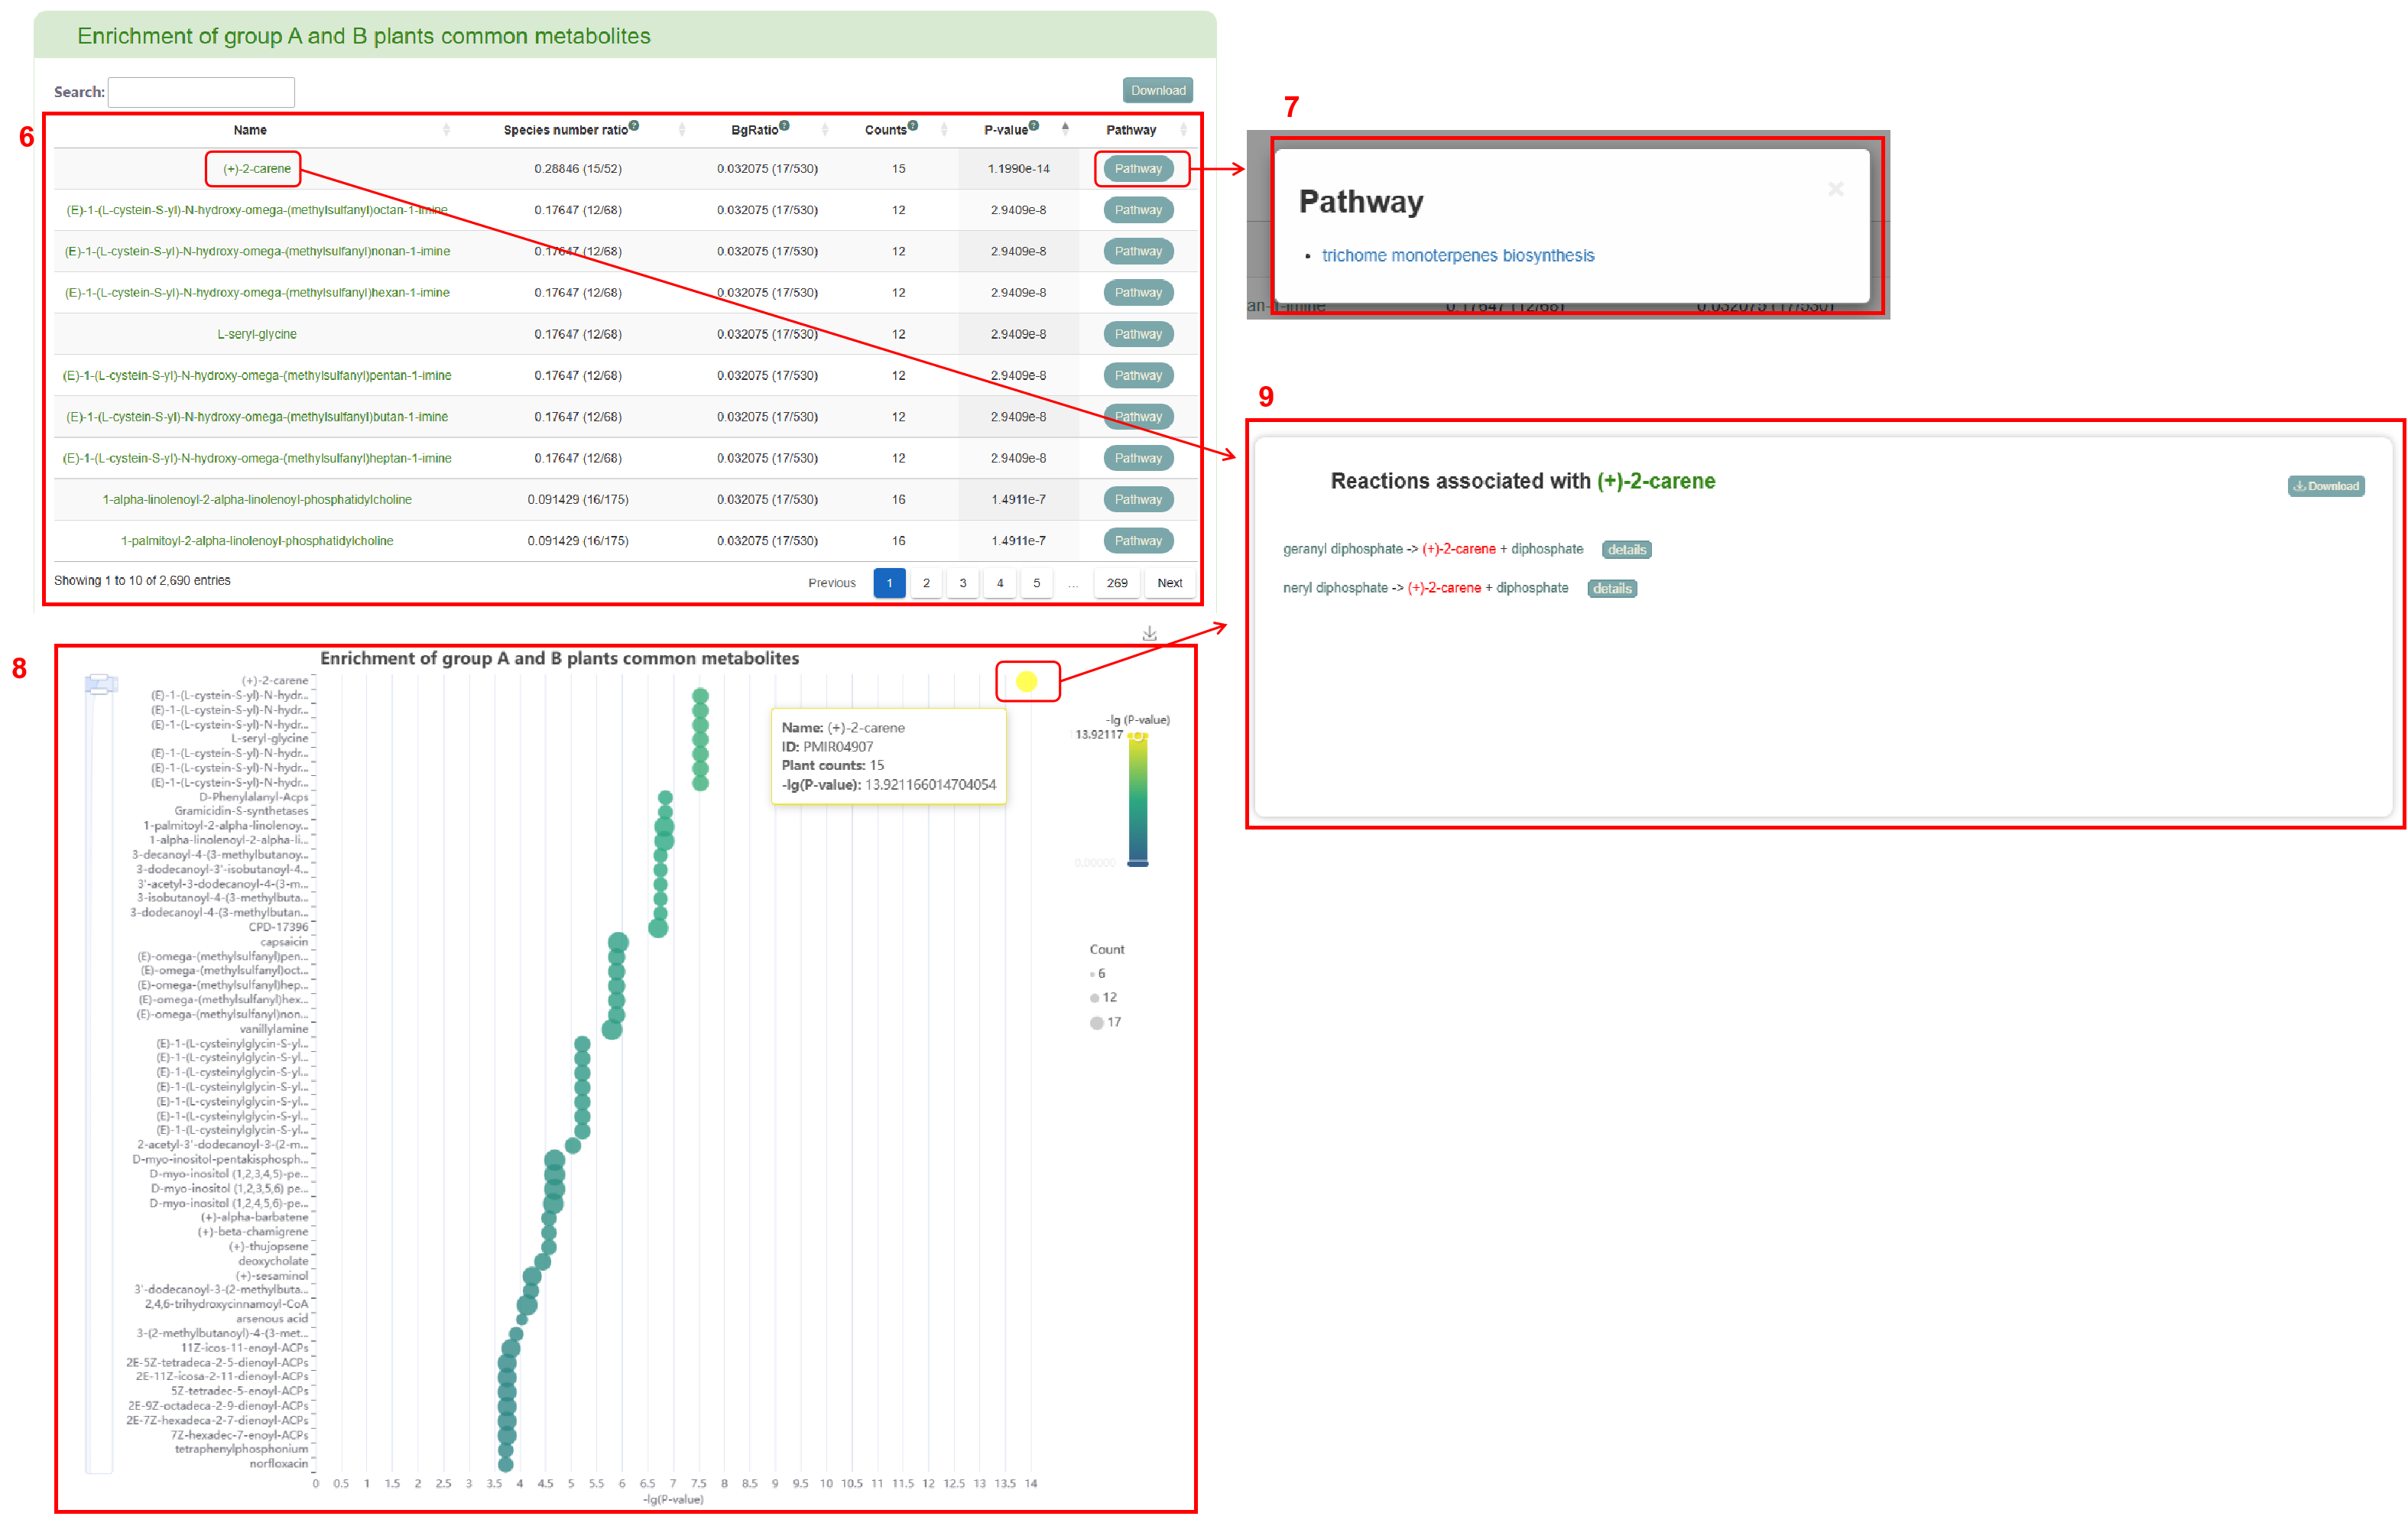
The first page of results displays the distribution of metabolite difference between group A and group B (box 5). Subsequently, the enrichment table of common or specific metabolites in group A and group B is displayed (box 6). Clicking the “Pathway” button enables users to obtain a list of pathways (box 7). If users click on the pathway name, the corresponding pathway page in the MetaCyc database will be retrieved. Users can also view the enrichment of common or specific metabolites in group A and group B. Moving the mouse over the bubble in the bubble diagram allow users to view the corresponding metabolite information (box 8). Clicking on the metabolite name in the table or the bubble in the bubble diagram provides access the reaction related to the metabolite (box 9).
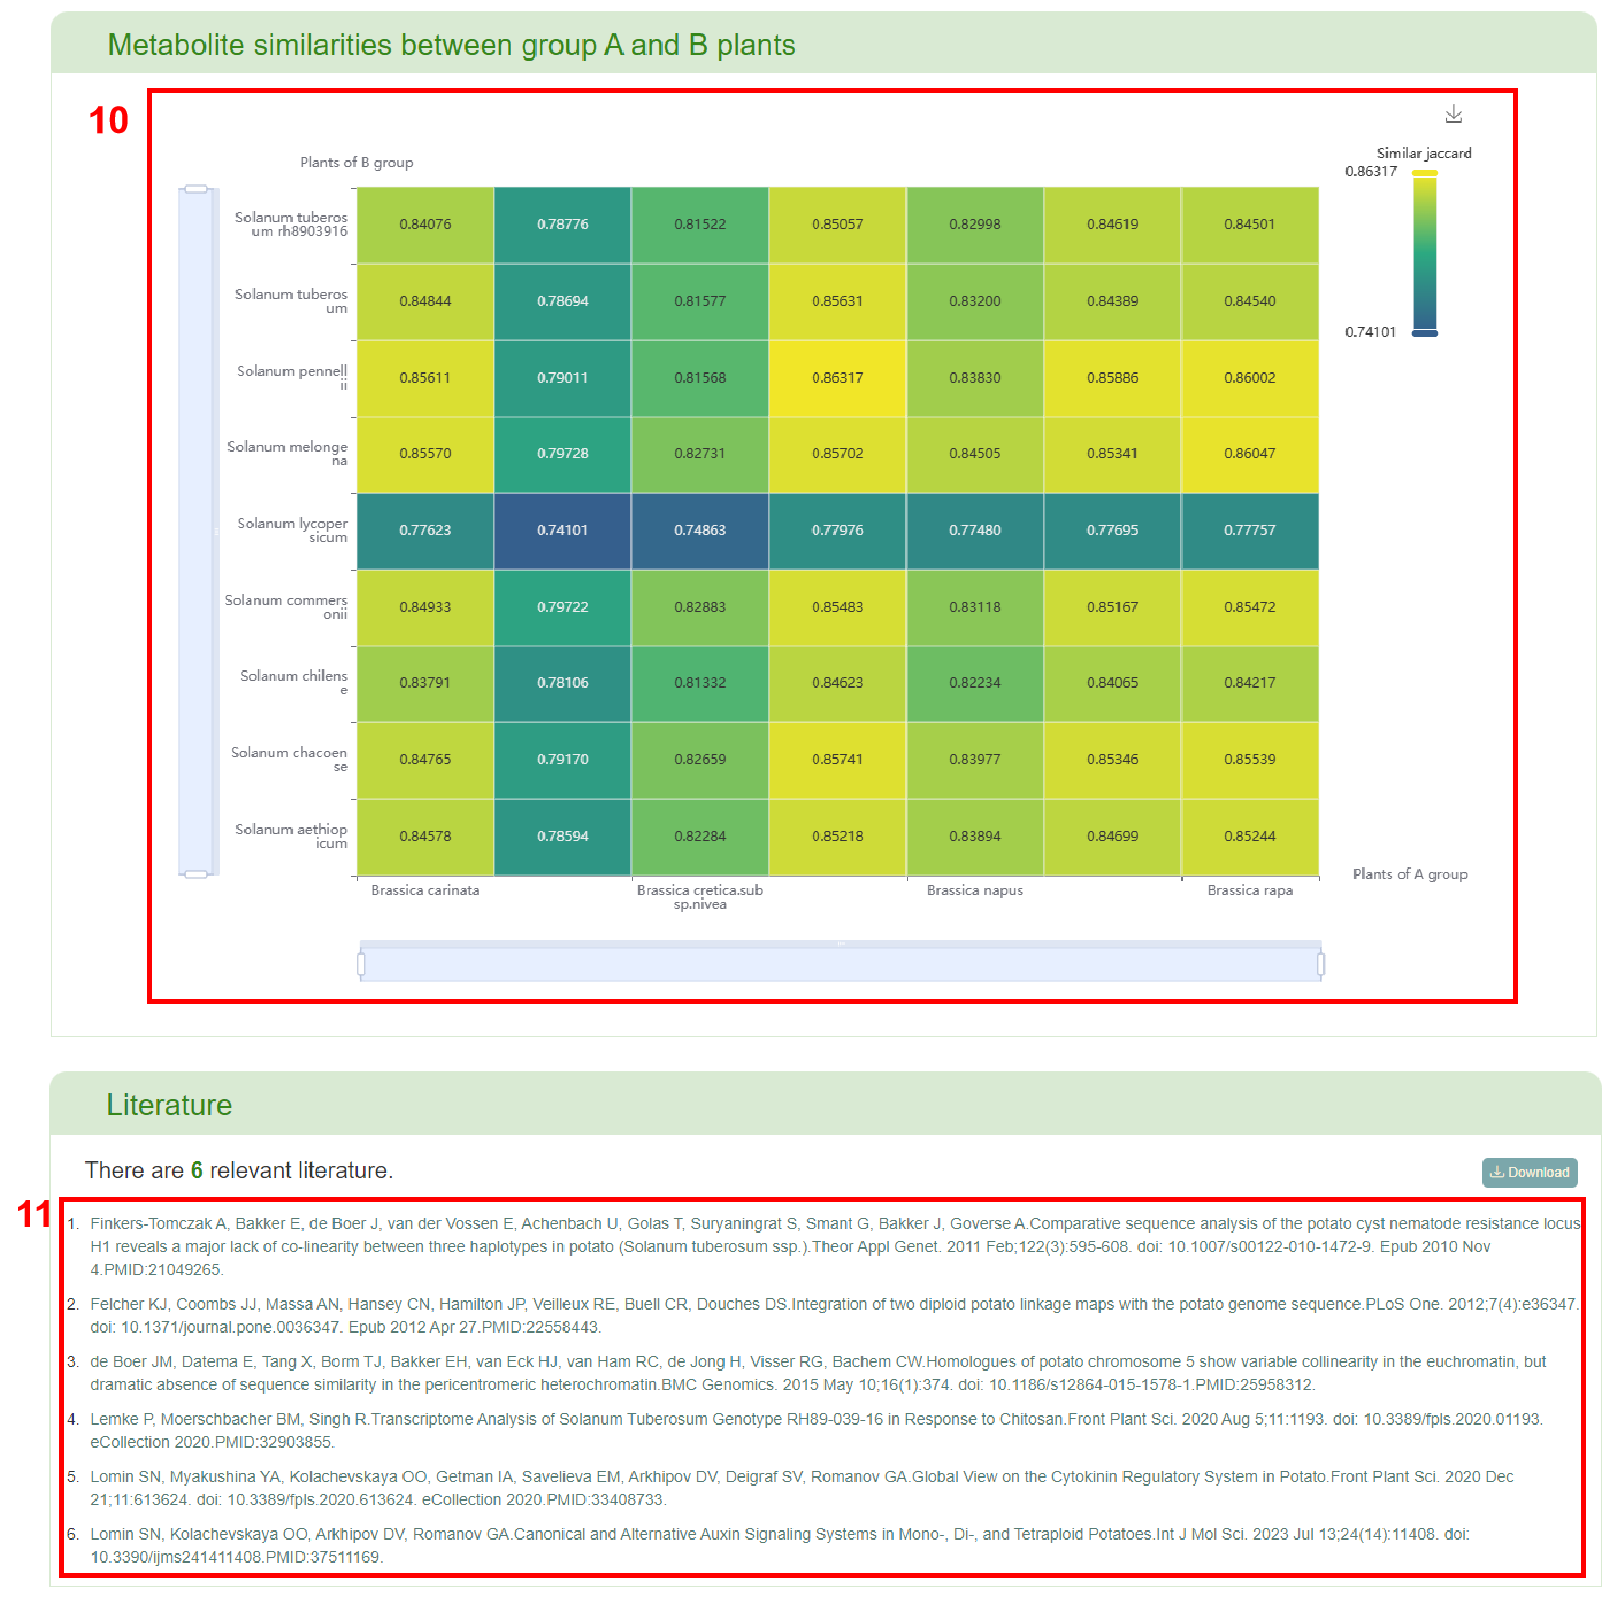
Furthermore, users can obtain a heat map of metabolite similarities between group A and group B plants (box 10), and a list of literature related to all plants in groups A and B (box 11).
Species list
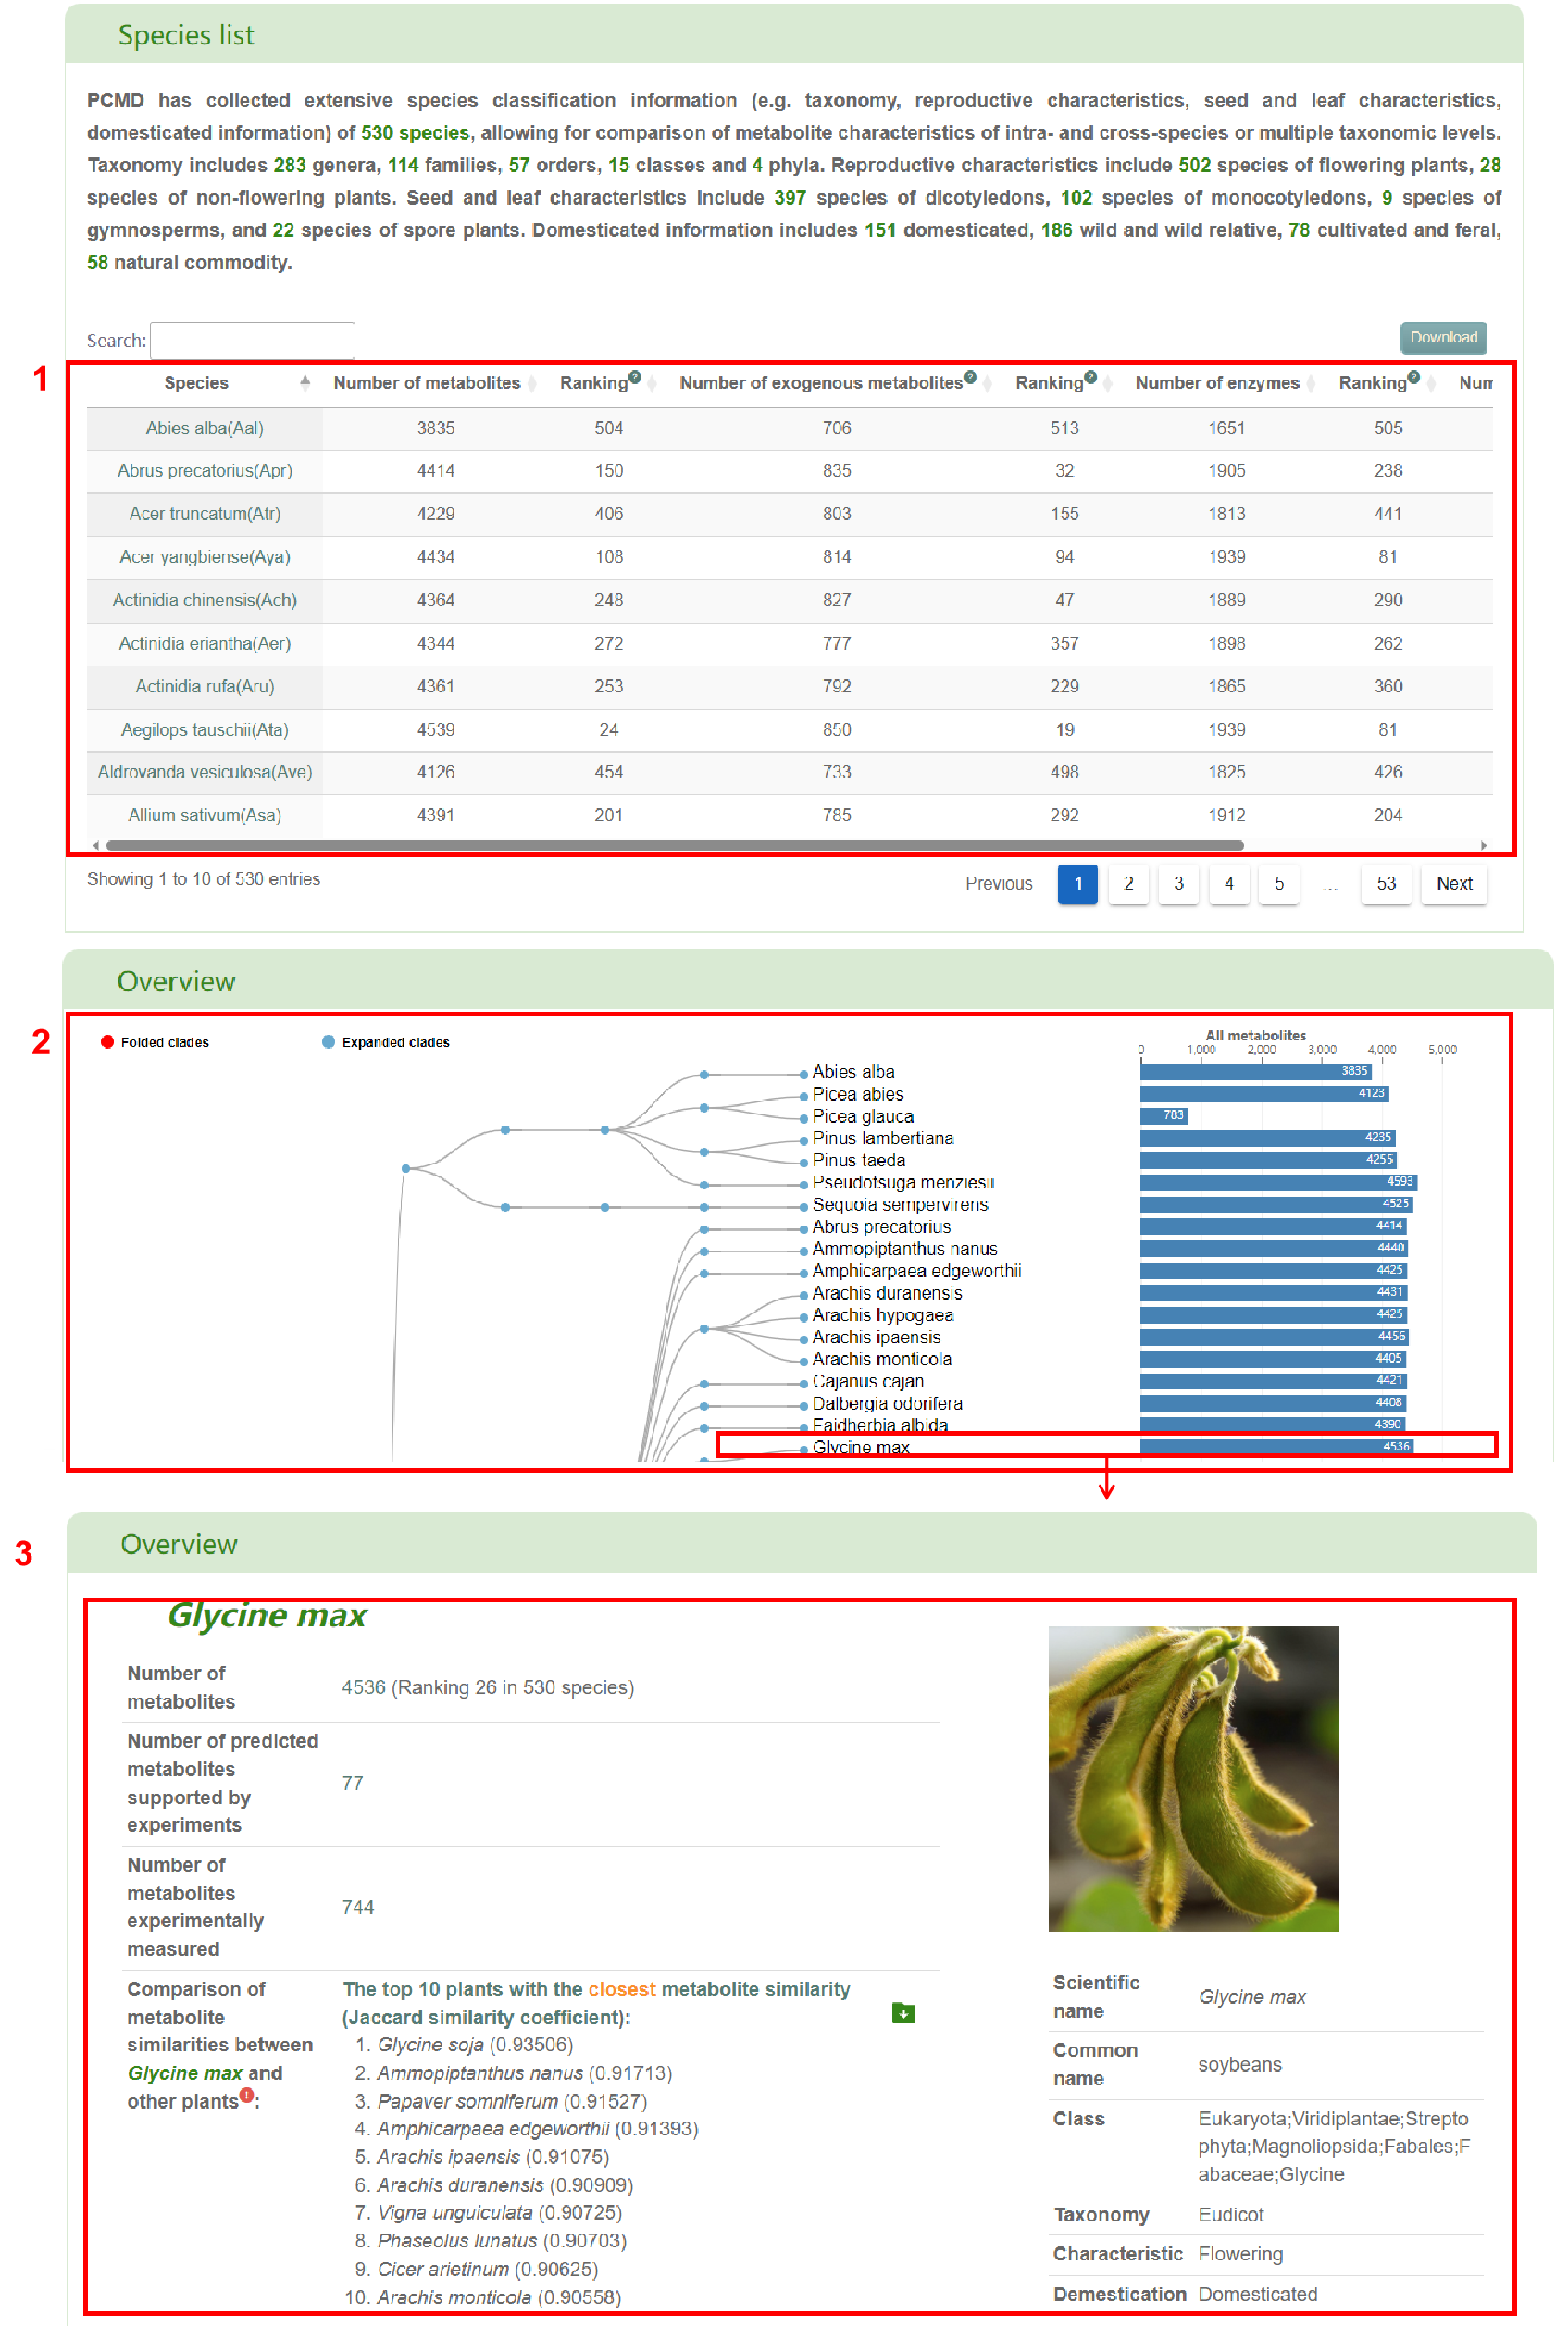
In the “Species list” module, PCMD has collected extensive species classification information (e.g. taxonomy, reproductive characteristics, seed and leaf characteristics, domesticated information) of 530 species, allowing for comparison of metabolite characteristics of intra- and cross-species or multiple taxonomic levels. Taxonomy includes 283 genera, 114 families, 57 orders, 15 classes and 4 phyla. Reproductive characteristics include 502 species of flowering plants, 28 species of non-flowering plants. Seed and leaf characteristics include 397 species of dicotyledons, 102 species of monocotyledons, 9 species of gymnosperms, and 22 species of spore plants. Domesticated information includes 151 domesticated, 186 wild and wild relative, 78 cultivated and feral, 58 natural commodity (box 1). By clicking on a species, users can access its position in the tree diagram (box 2). Additionally, users can access the corresponding species details page by clicking on the species branch in the tree diagram or the corresponding bar chart (box 3).
Search metabolites
The “Search metabolites” page provides detailed information of metabolite in PCMD. The following tutorial video will provide a comprehensive overview of this page.
Alternatively, users can explore the tutorial below to learn about the functionality of this page.
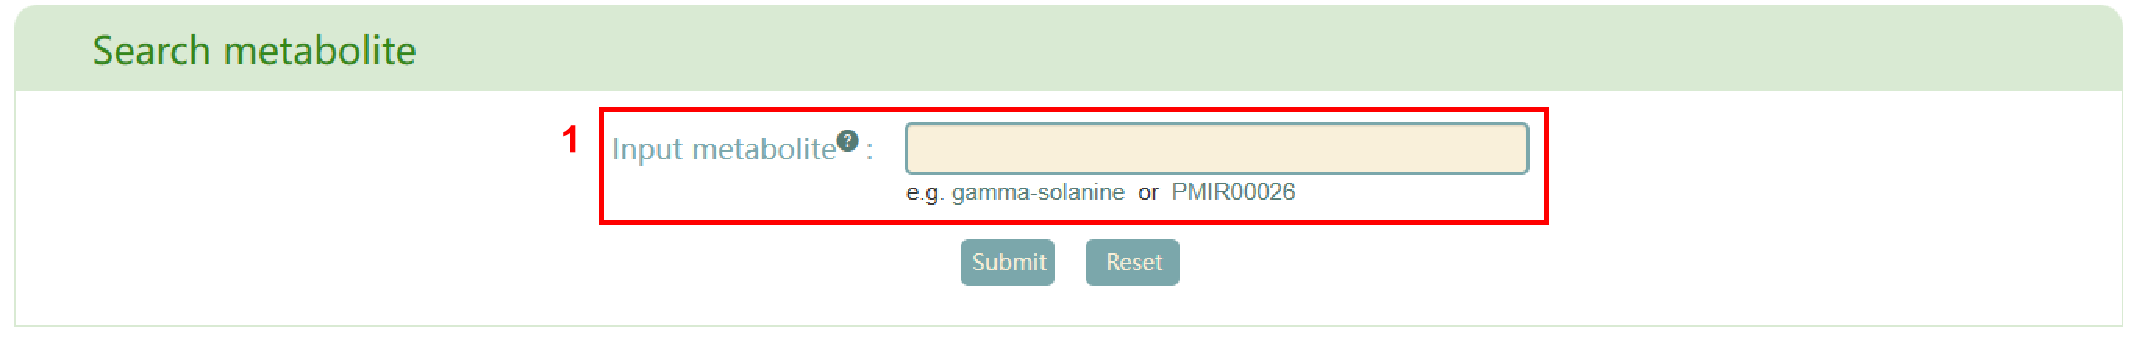
The “Search metabolites” page is mainly divided into two parts: “Search metabolite” and “Browse metabolites”. In the “Search metabolite” section, users can input the name or ID in PCMD of a metabolite (box 1), and then click the “Submit” button to retrieve the related information of the metabolite.
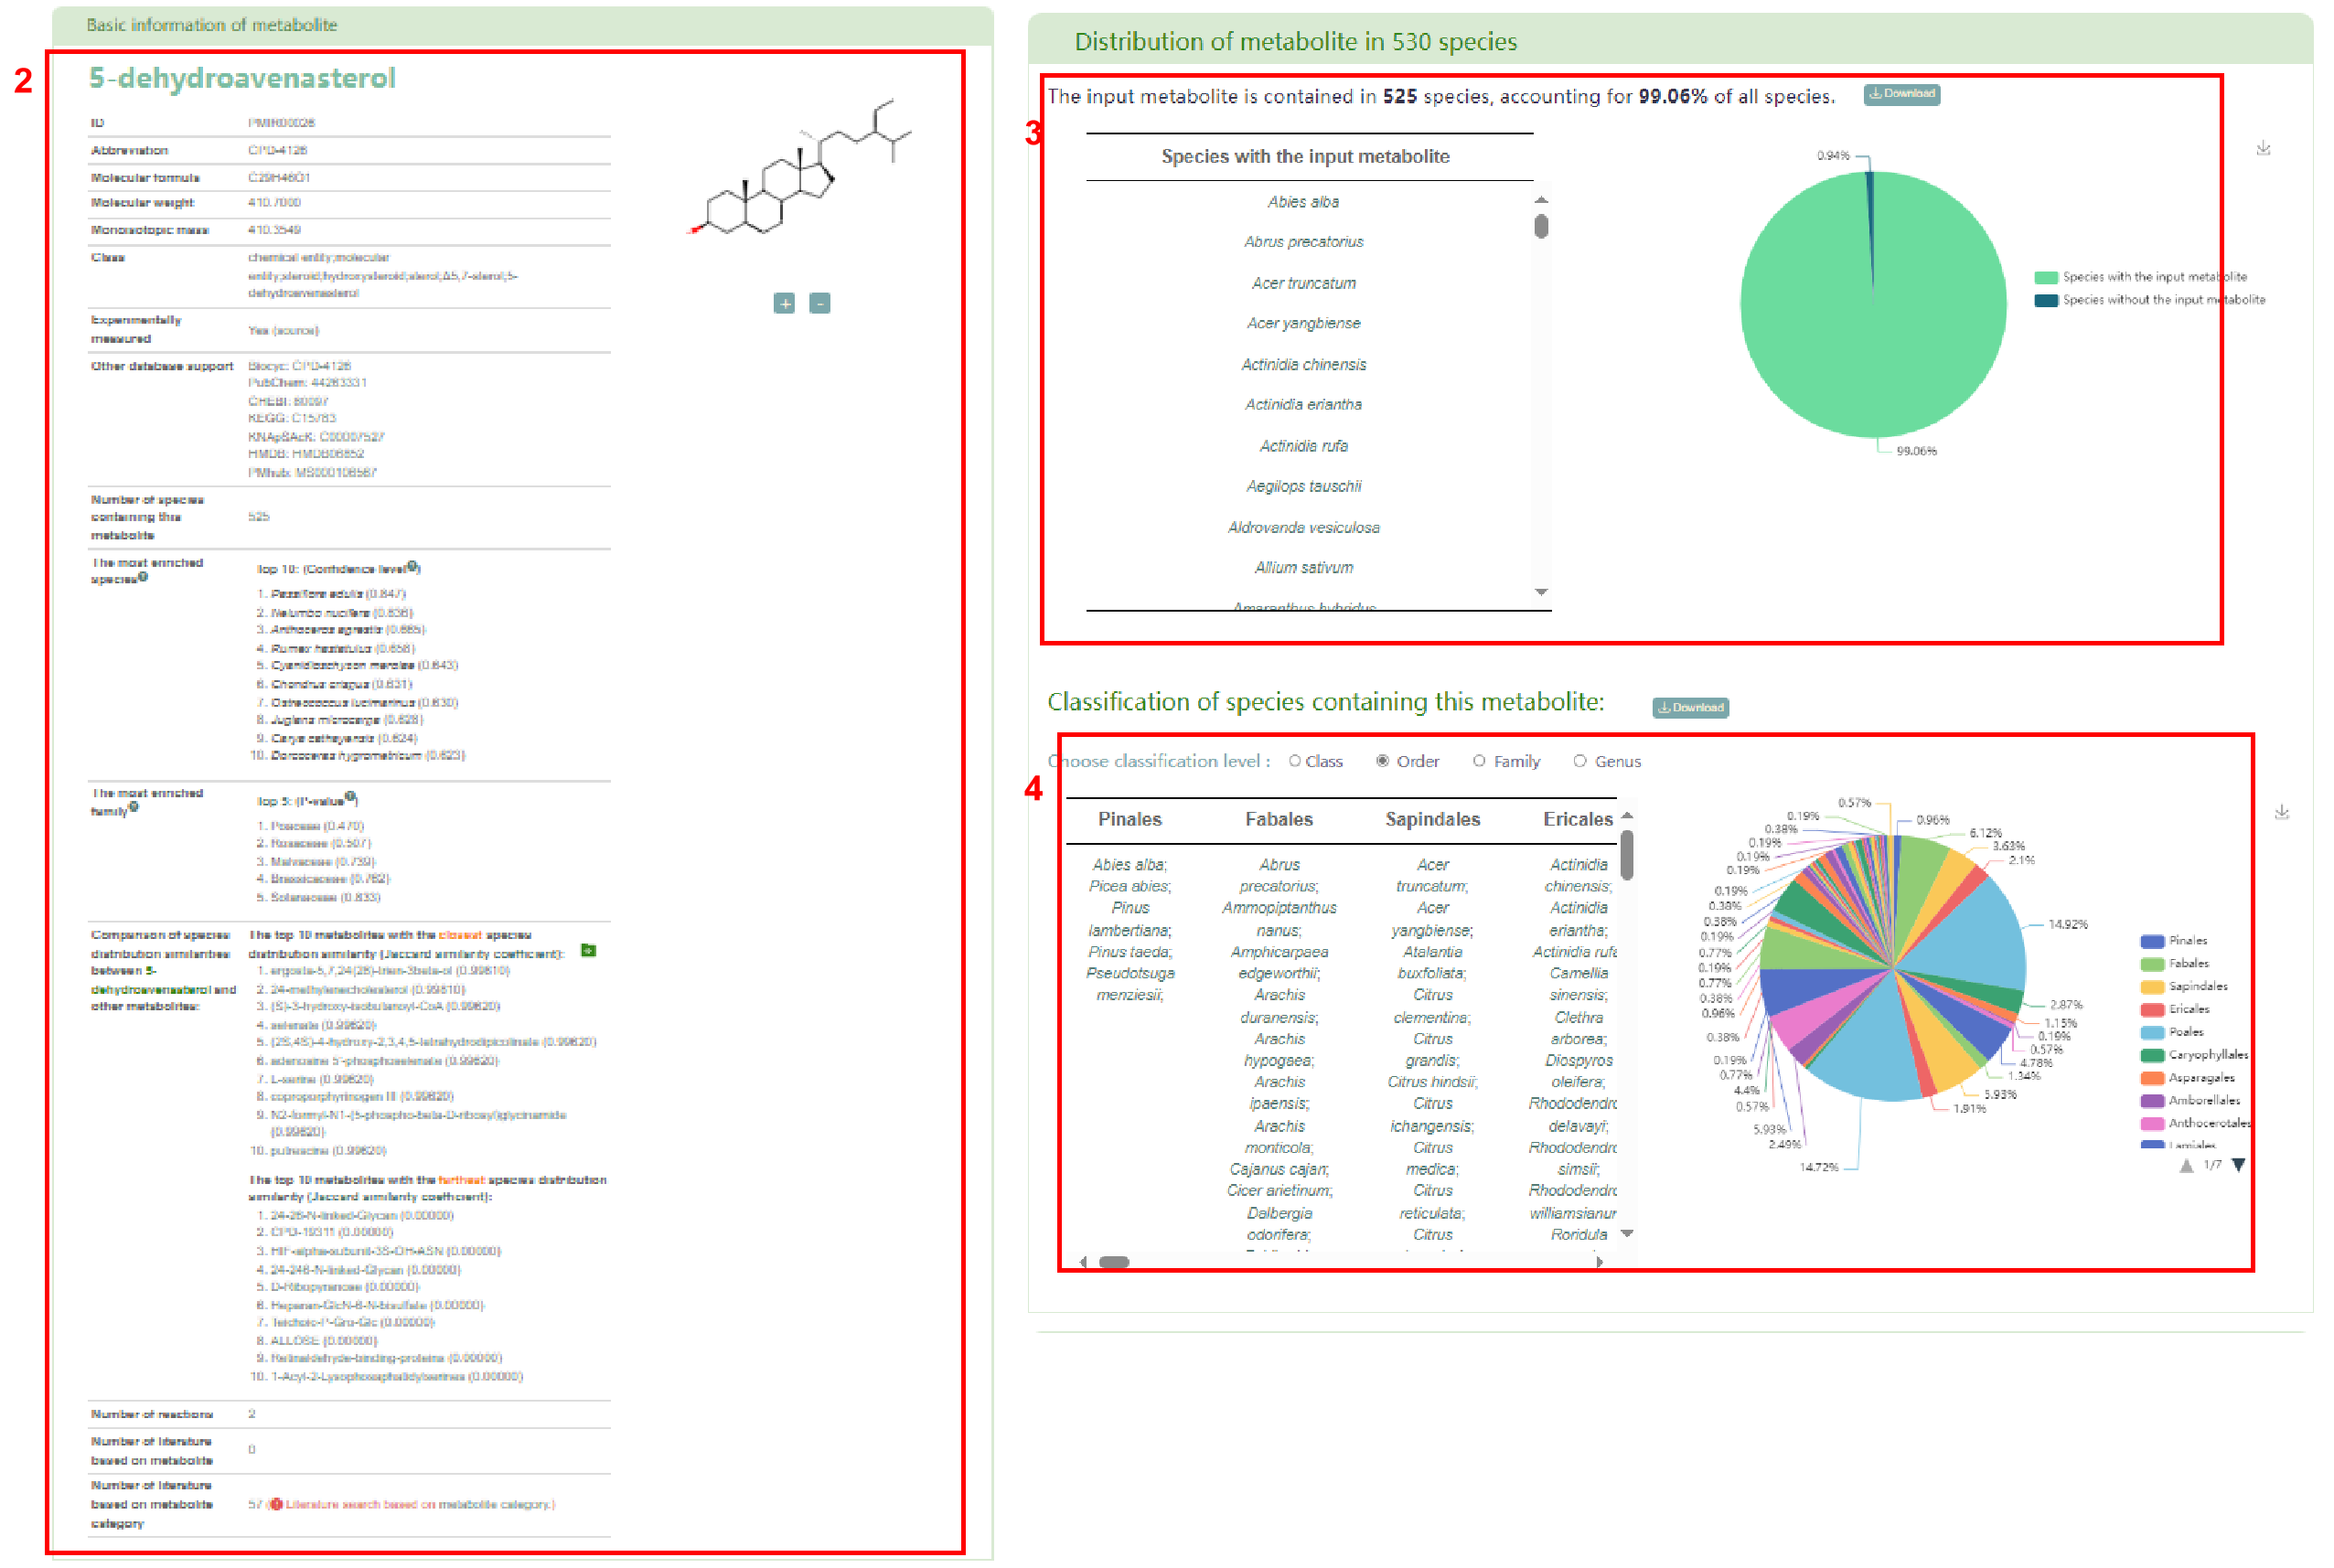
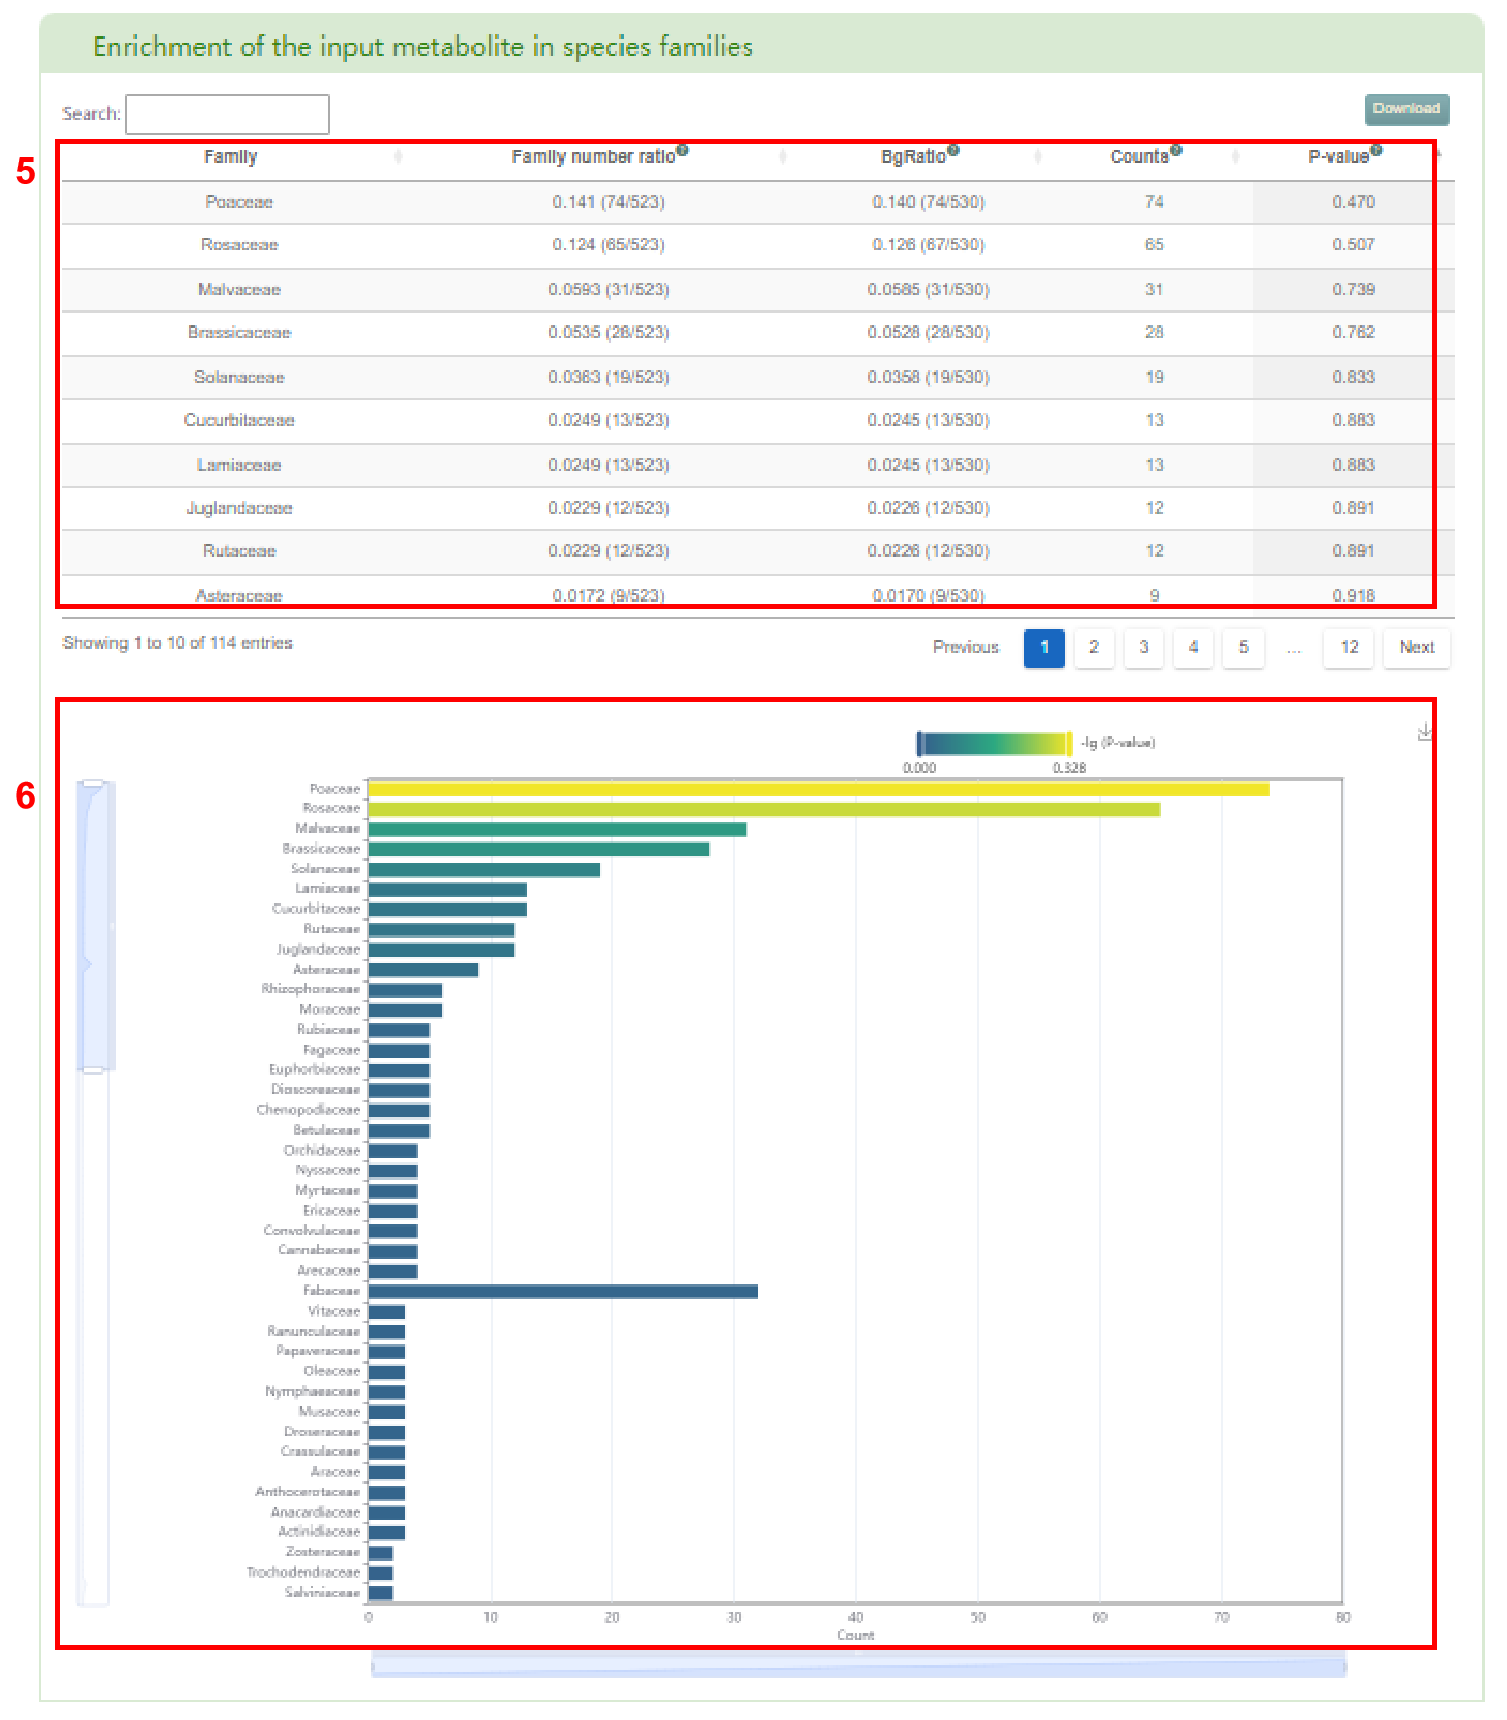
The first page of results is basic information about the metabolite (box 2), the distribution of metabolite in 530 species (box 3) and the classification of the species containing this metabolite (box 4). Users can also access the enrichment table (box 5) and bar chart (box 6) of species by family.
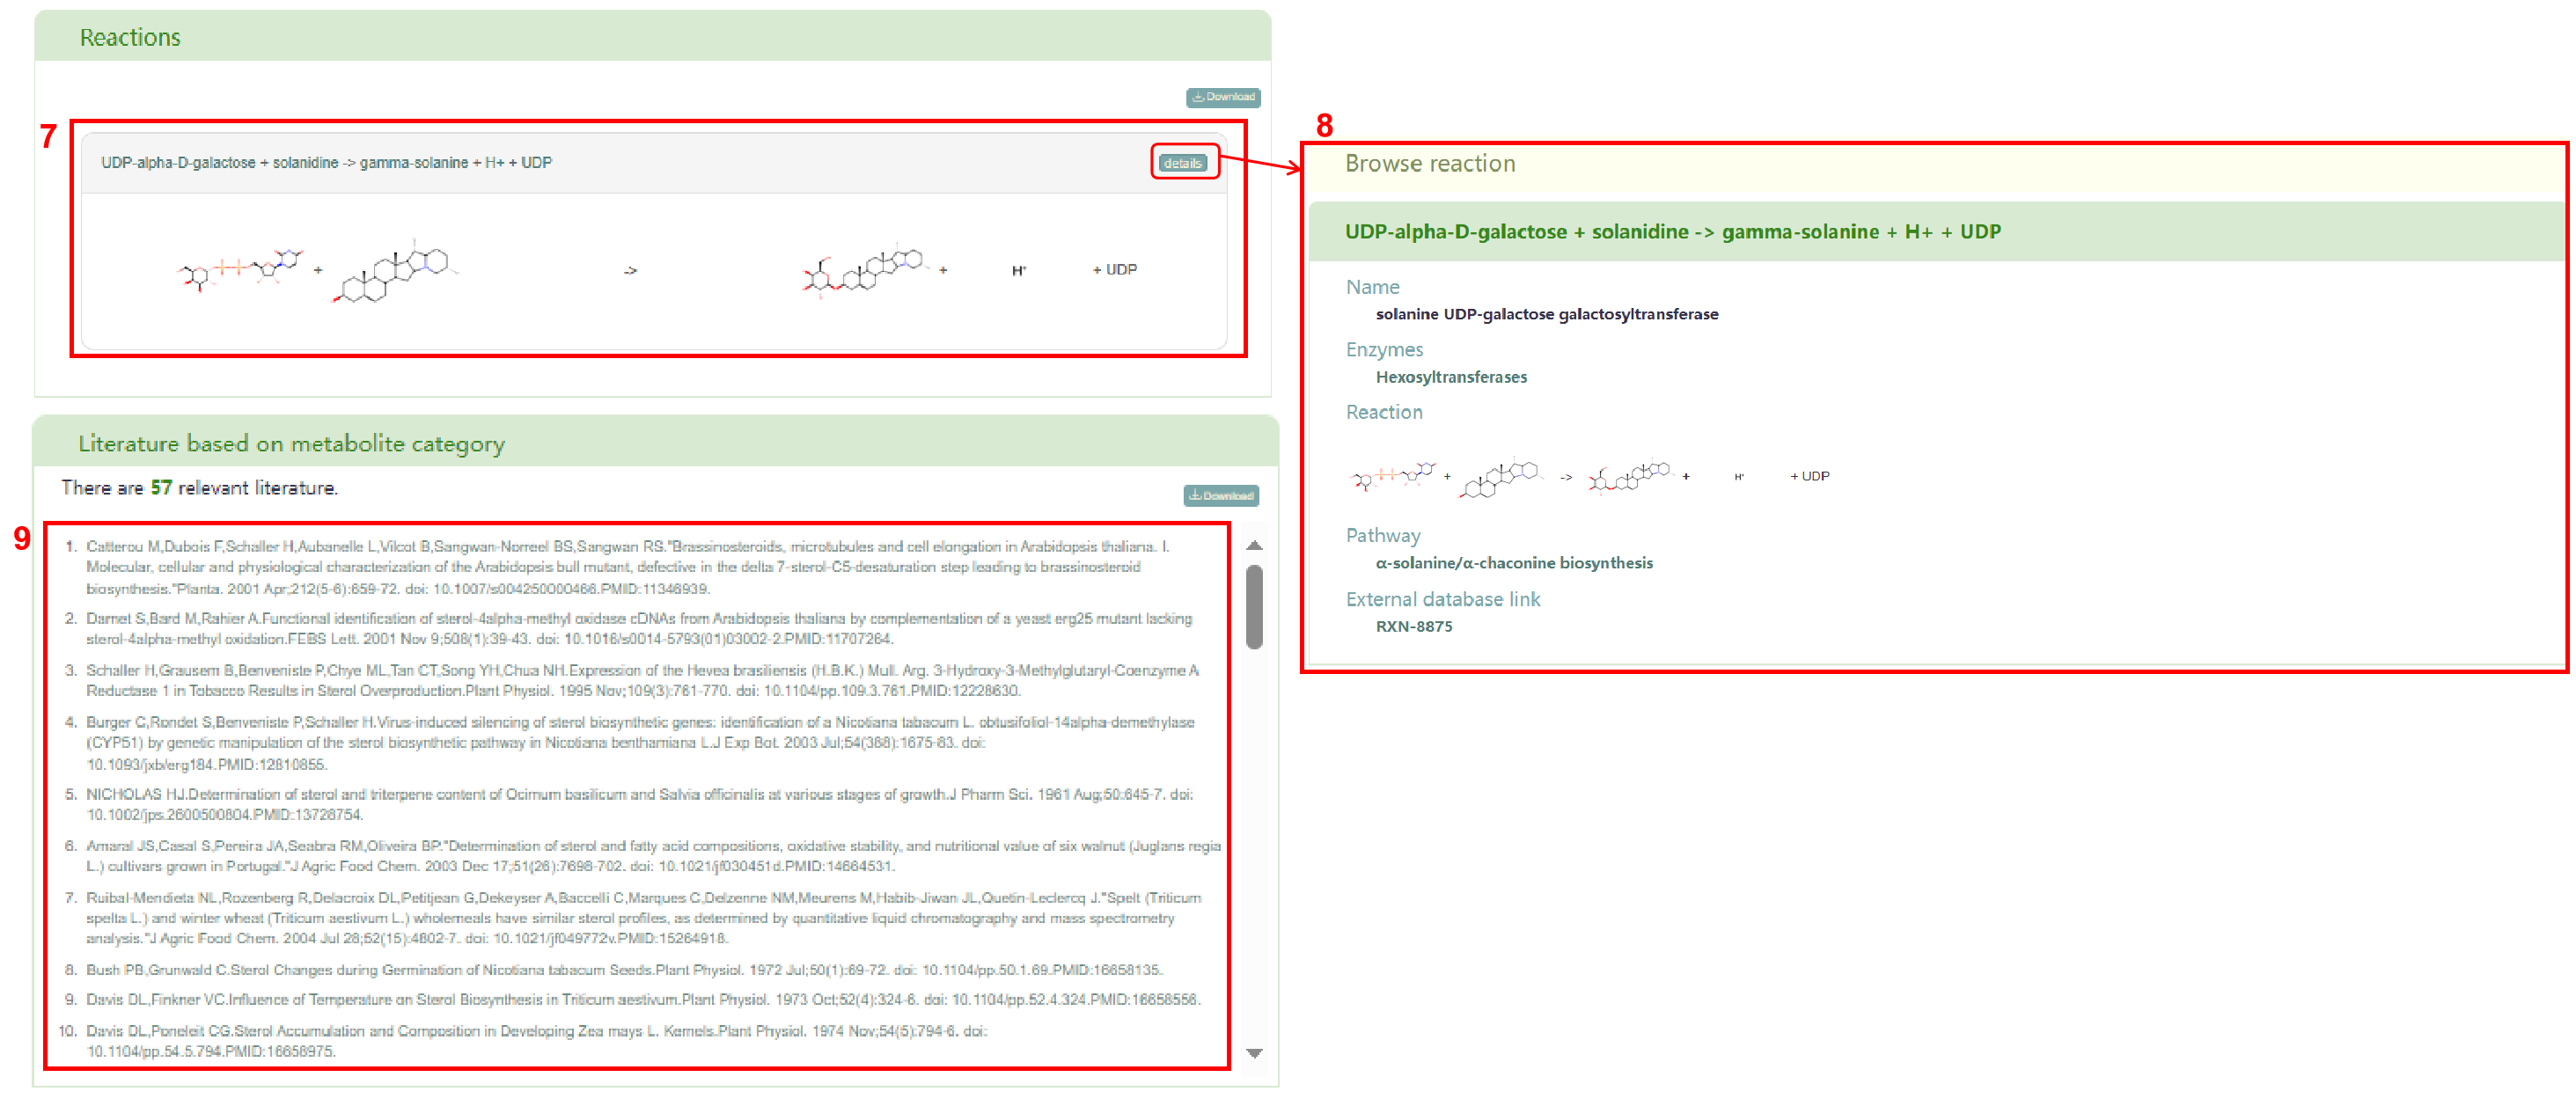
Additionally, users can obtain reactions associated with the metabolite (box 7). Clicking on the “details” button allow users to access the detailed information page of the reaction (box 8). The list of literature based on metabolite category can be obtained in box 9.
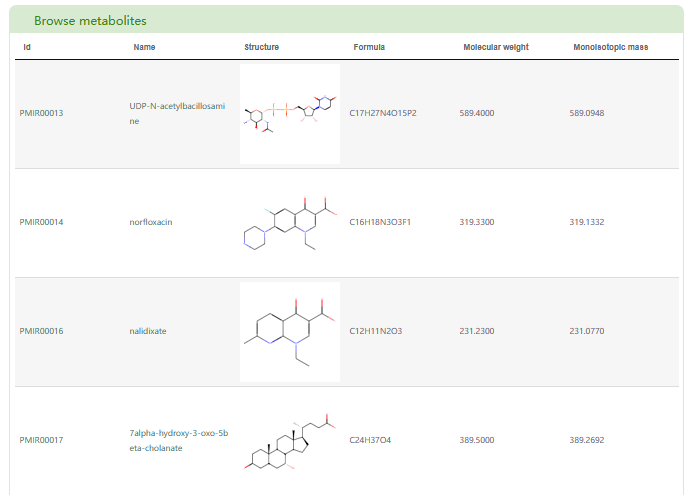
In the “Browse metabolites” section, basic information about metabolites in PCMD is displayed. By clicking the metabolite ID, users can access the metabolite page in PCMD. Clicking the metabolite name allows users to access the metabolite’s detail information page.
Search structure
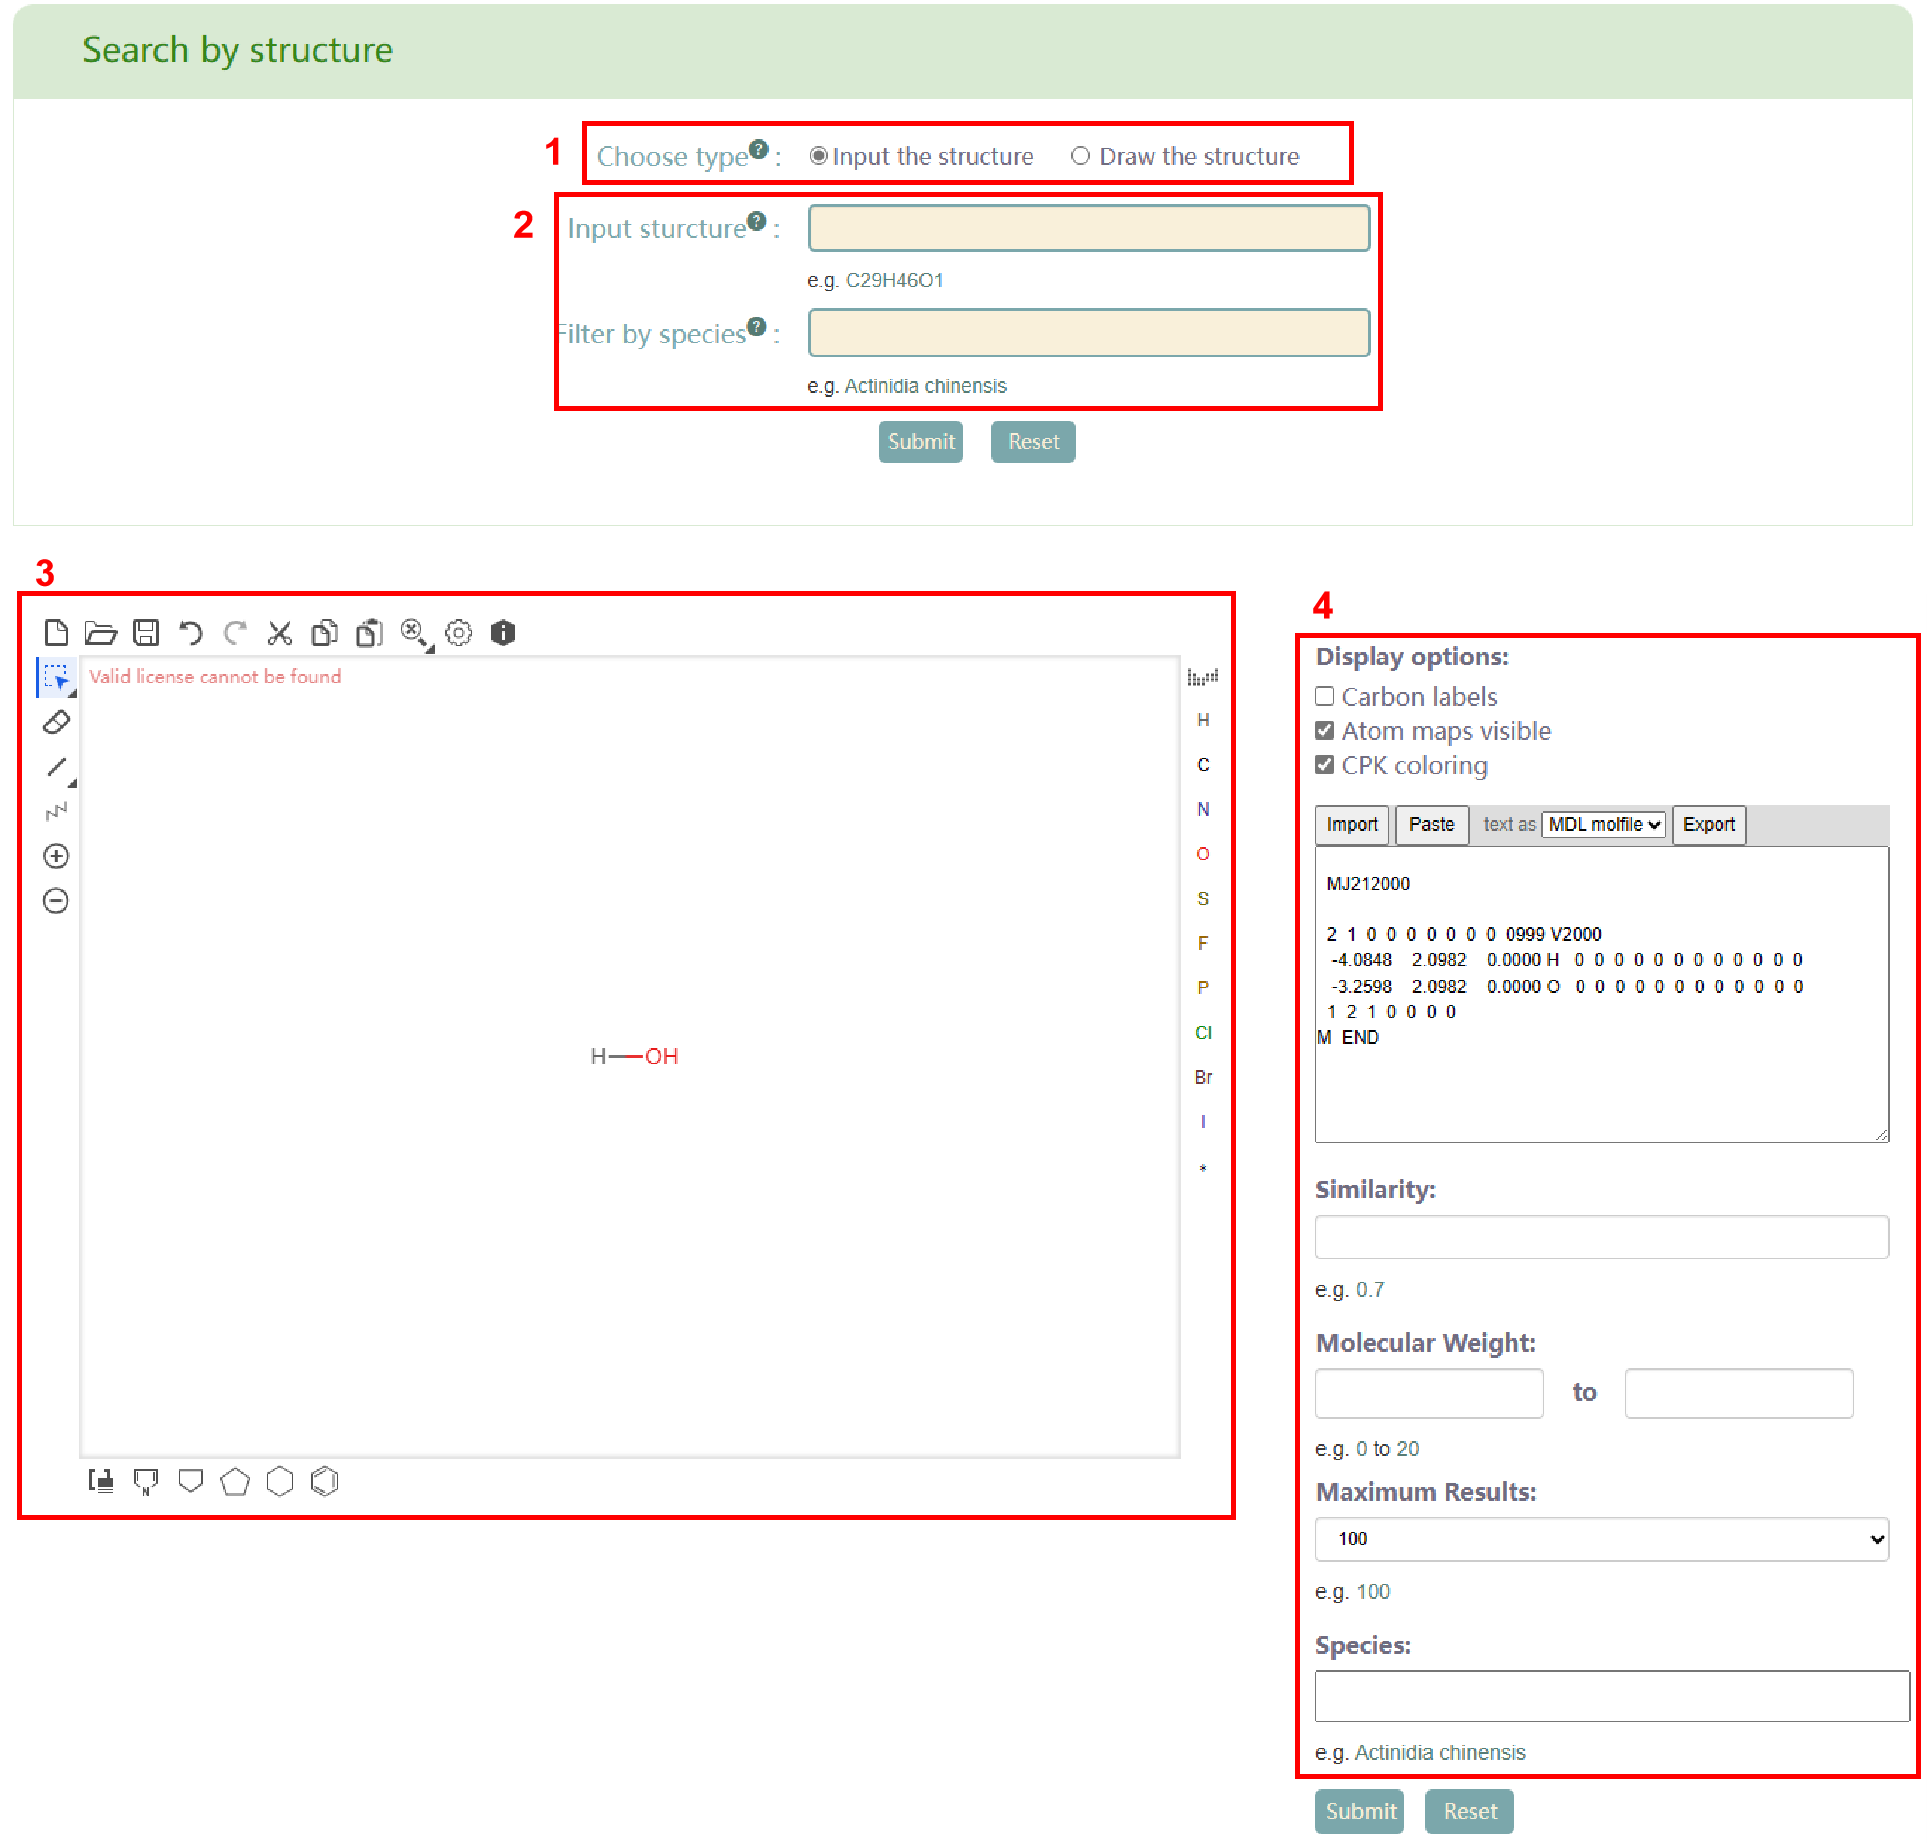
The “Search structure” module offers two search modes (box 1): Input the structure and Draw the structure. When selecting “Input the structure”, users need to input the structural formula of metabolites and species of metabolites (box 2). On the other hand, when selecting “Draw the structure”, users need to draw the structural formula diagram of the metabolite (box 3) using the plug-in, generate the mol formula of the metabolite, and input the supported similarity, molecular weight, maximum output result and species (box 4). Afterward, users can click the "Submit" button to obtain the list of metabolites that meet their requirements (box 5). Moreover, in search results (box 5), users can access the metabolite page in PCMD by clicking on the metabolite ID and the metabolite's details page by clicking on the metabolite name.
Search molecular weight
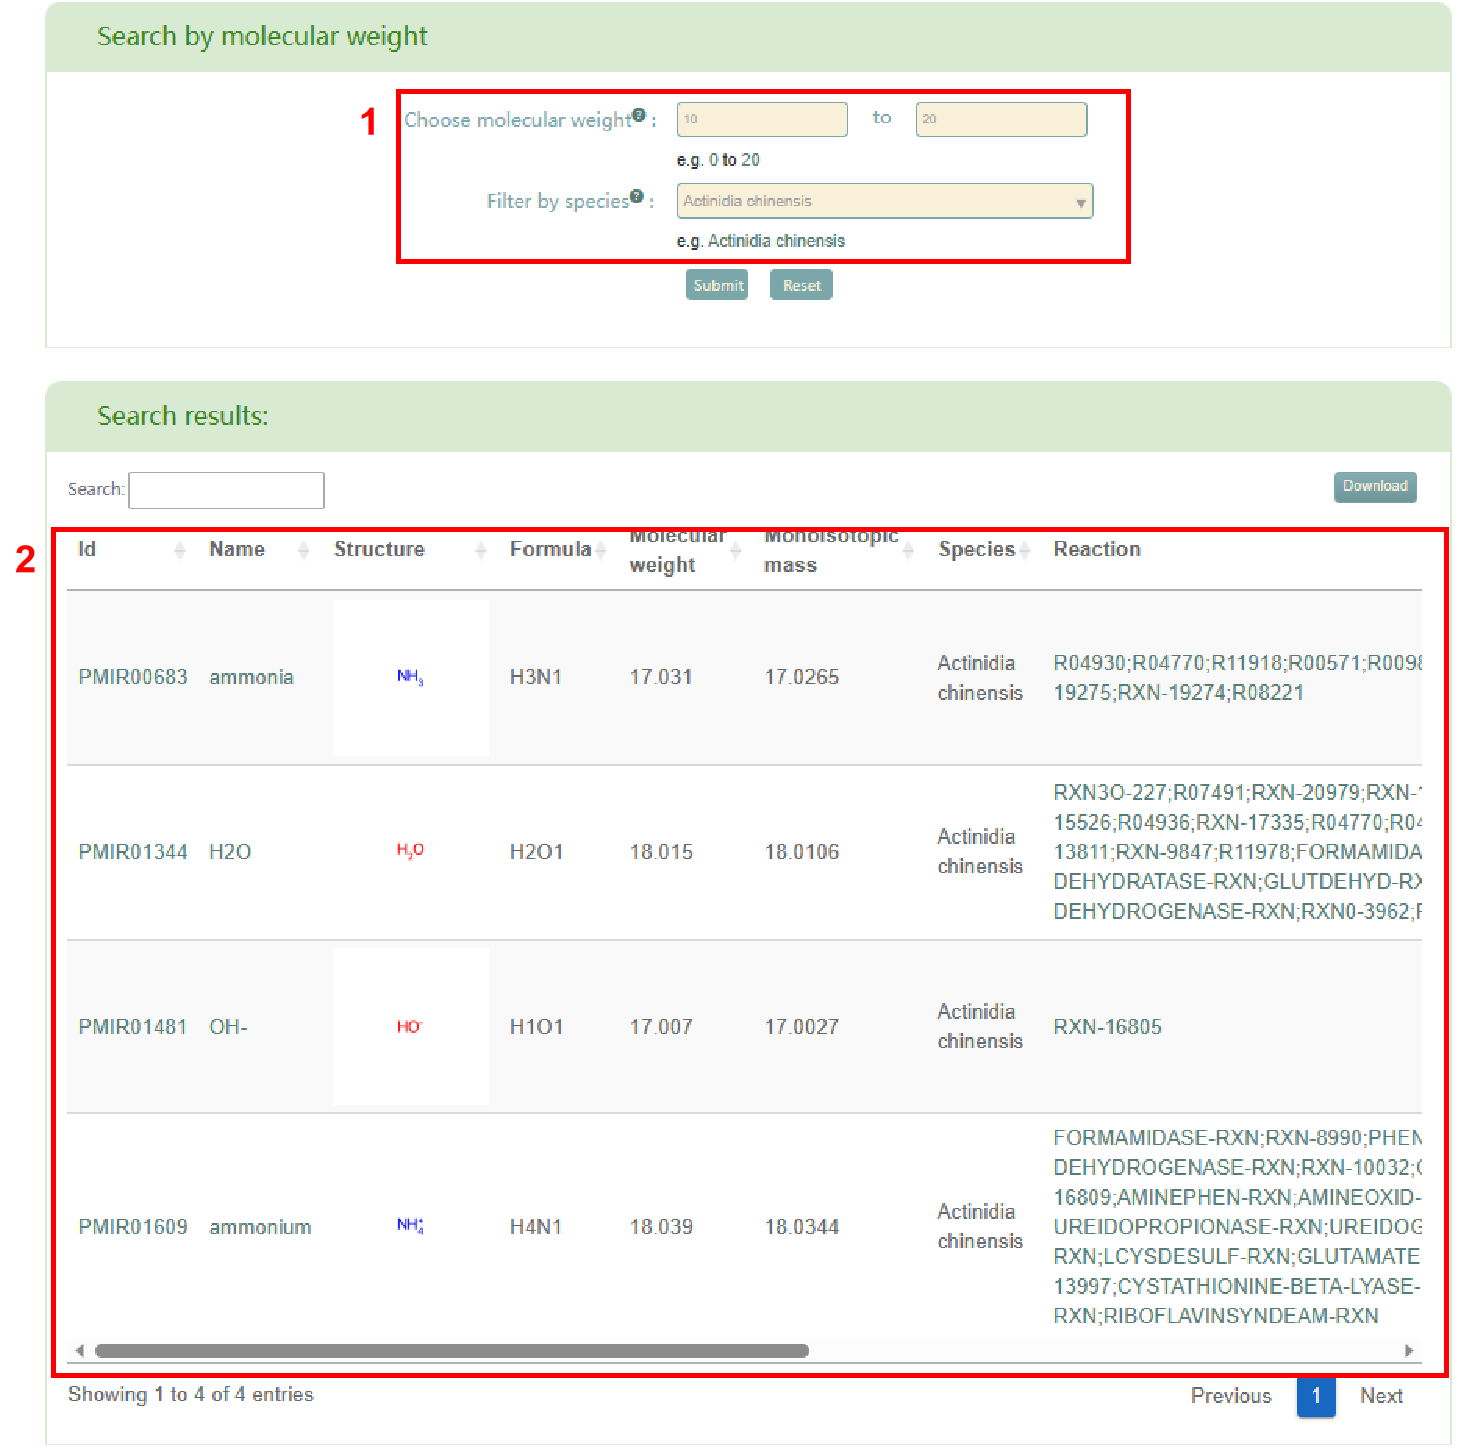
In the “Search molecular weight” module, users can search for metabolites by molecular weight. Users enter the range of molecular weight and species in box 1, and then click the "Submit" button to obtain the list of metabolites that meet their requirements (box 2). Similarly, in the search results, users can access the metabolite page in PCMD by clicking on the metabolite ID and the metabolite's details page by clicking on the metabolite name.
Metabolites-enrichment
The “Metabolites-enrichment” module allows users to perform an enrichment analysis of a group of metabolites. Users can watch the tutorial video below to understand the detailed usage of the page.
Alternatively, users can explore the tutorial below to learn about the functionality of this page.
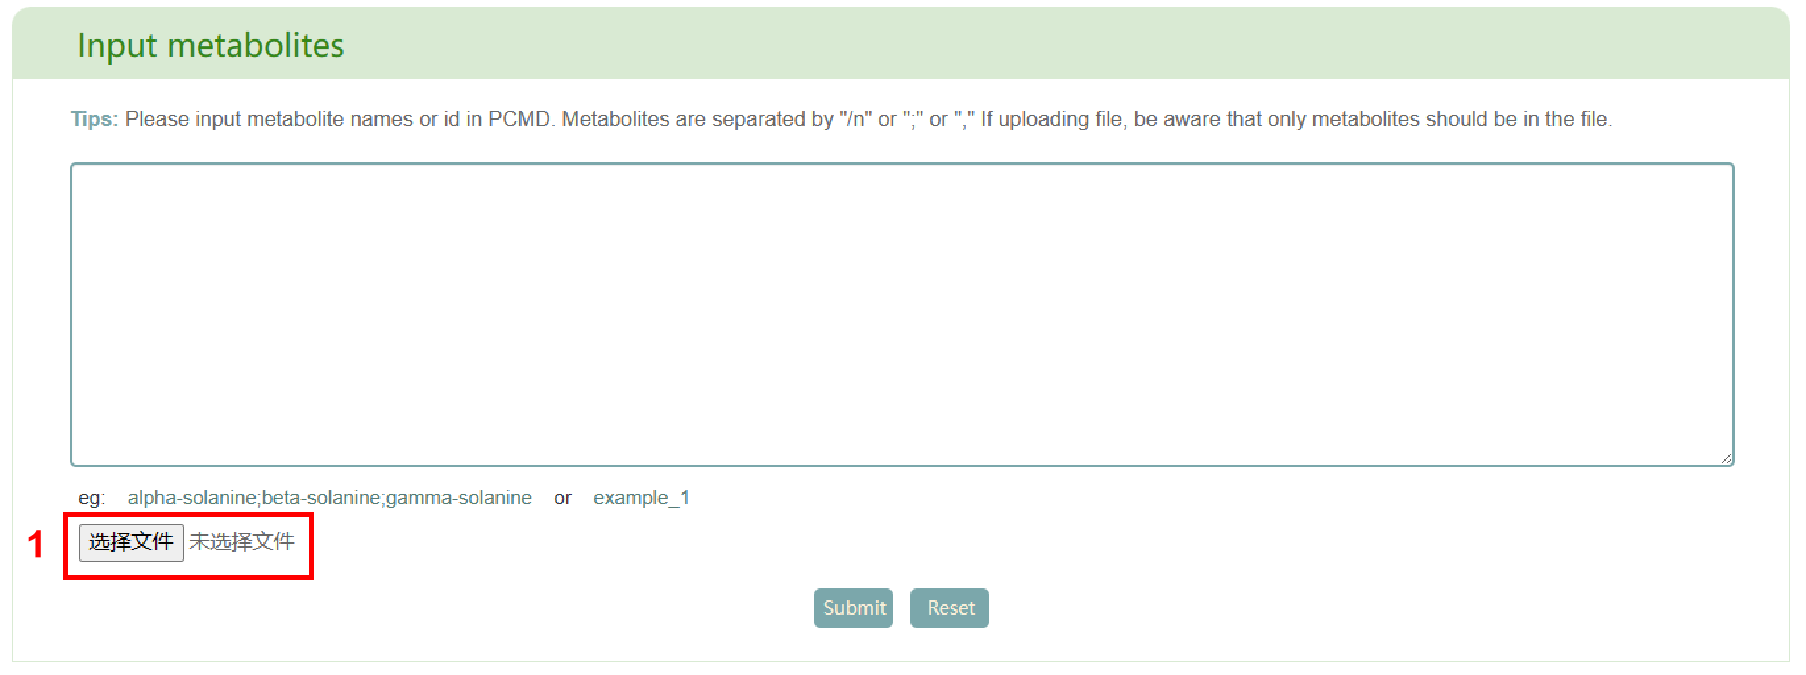
In this page, users can input a group of metabolite names or upload a metabolite file (box 1) and click the "Submit" button to obtain the related results.
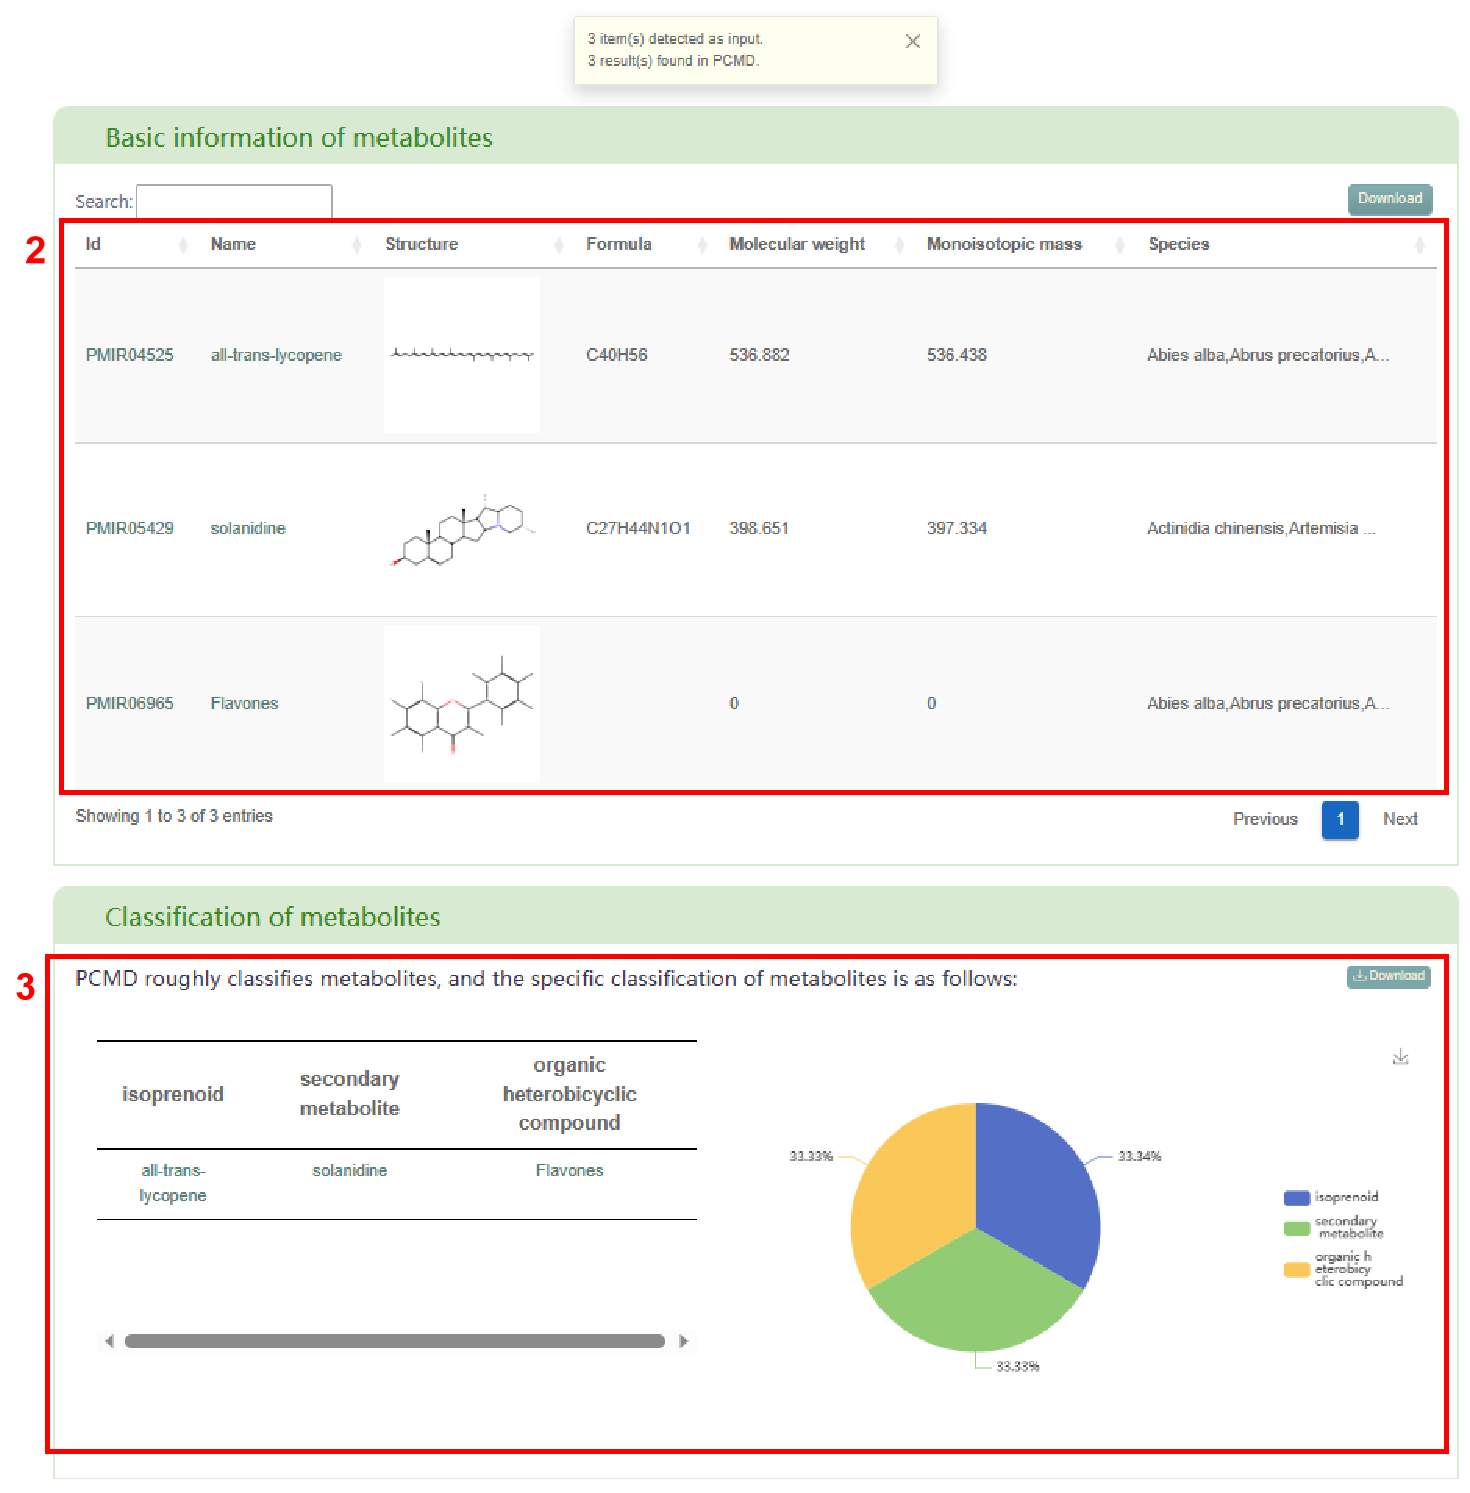
The first page of results displays the basic information of metabolites (box 2) and the classification of metabolite (box 3), which is defined by PCMD. Users can also access the metabolite page in PCMD by clicking on the metabolite ID and the metabolite’s detail information page by clicking on the metabolite name.
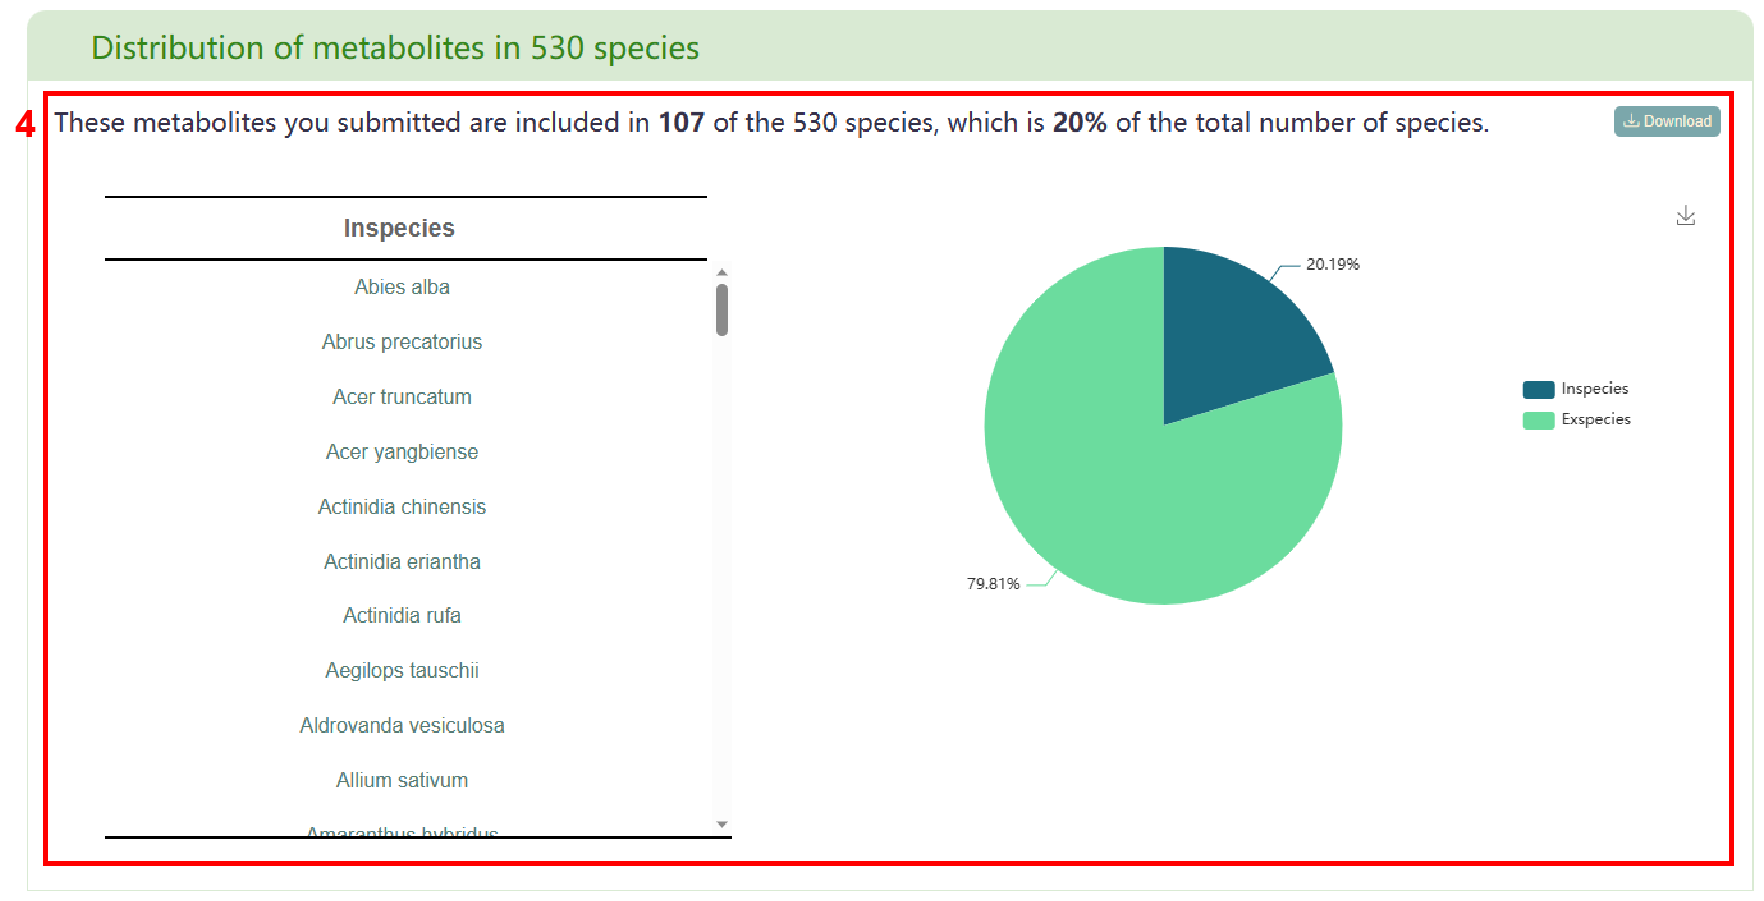
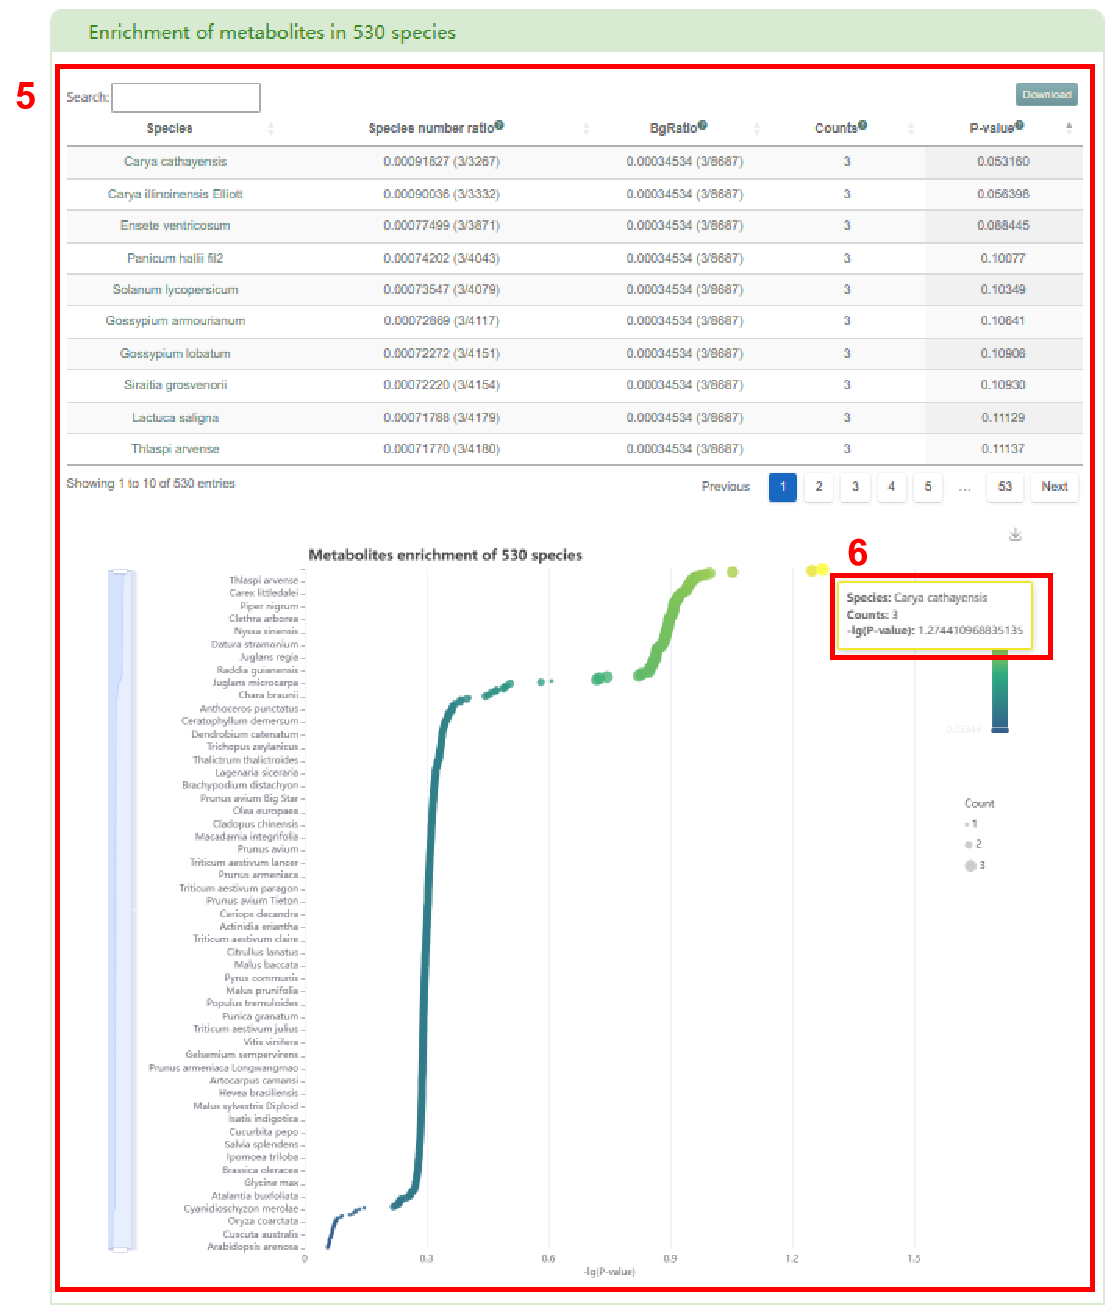
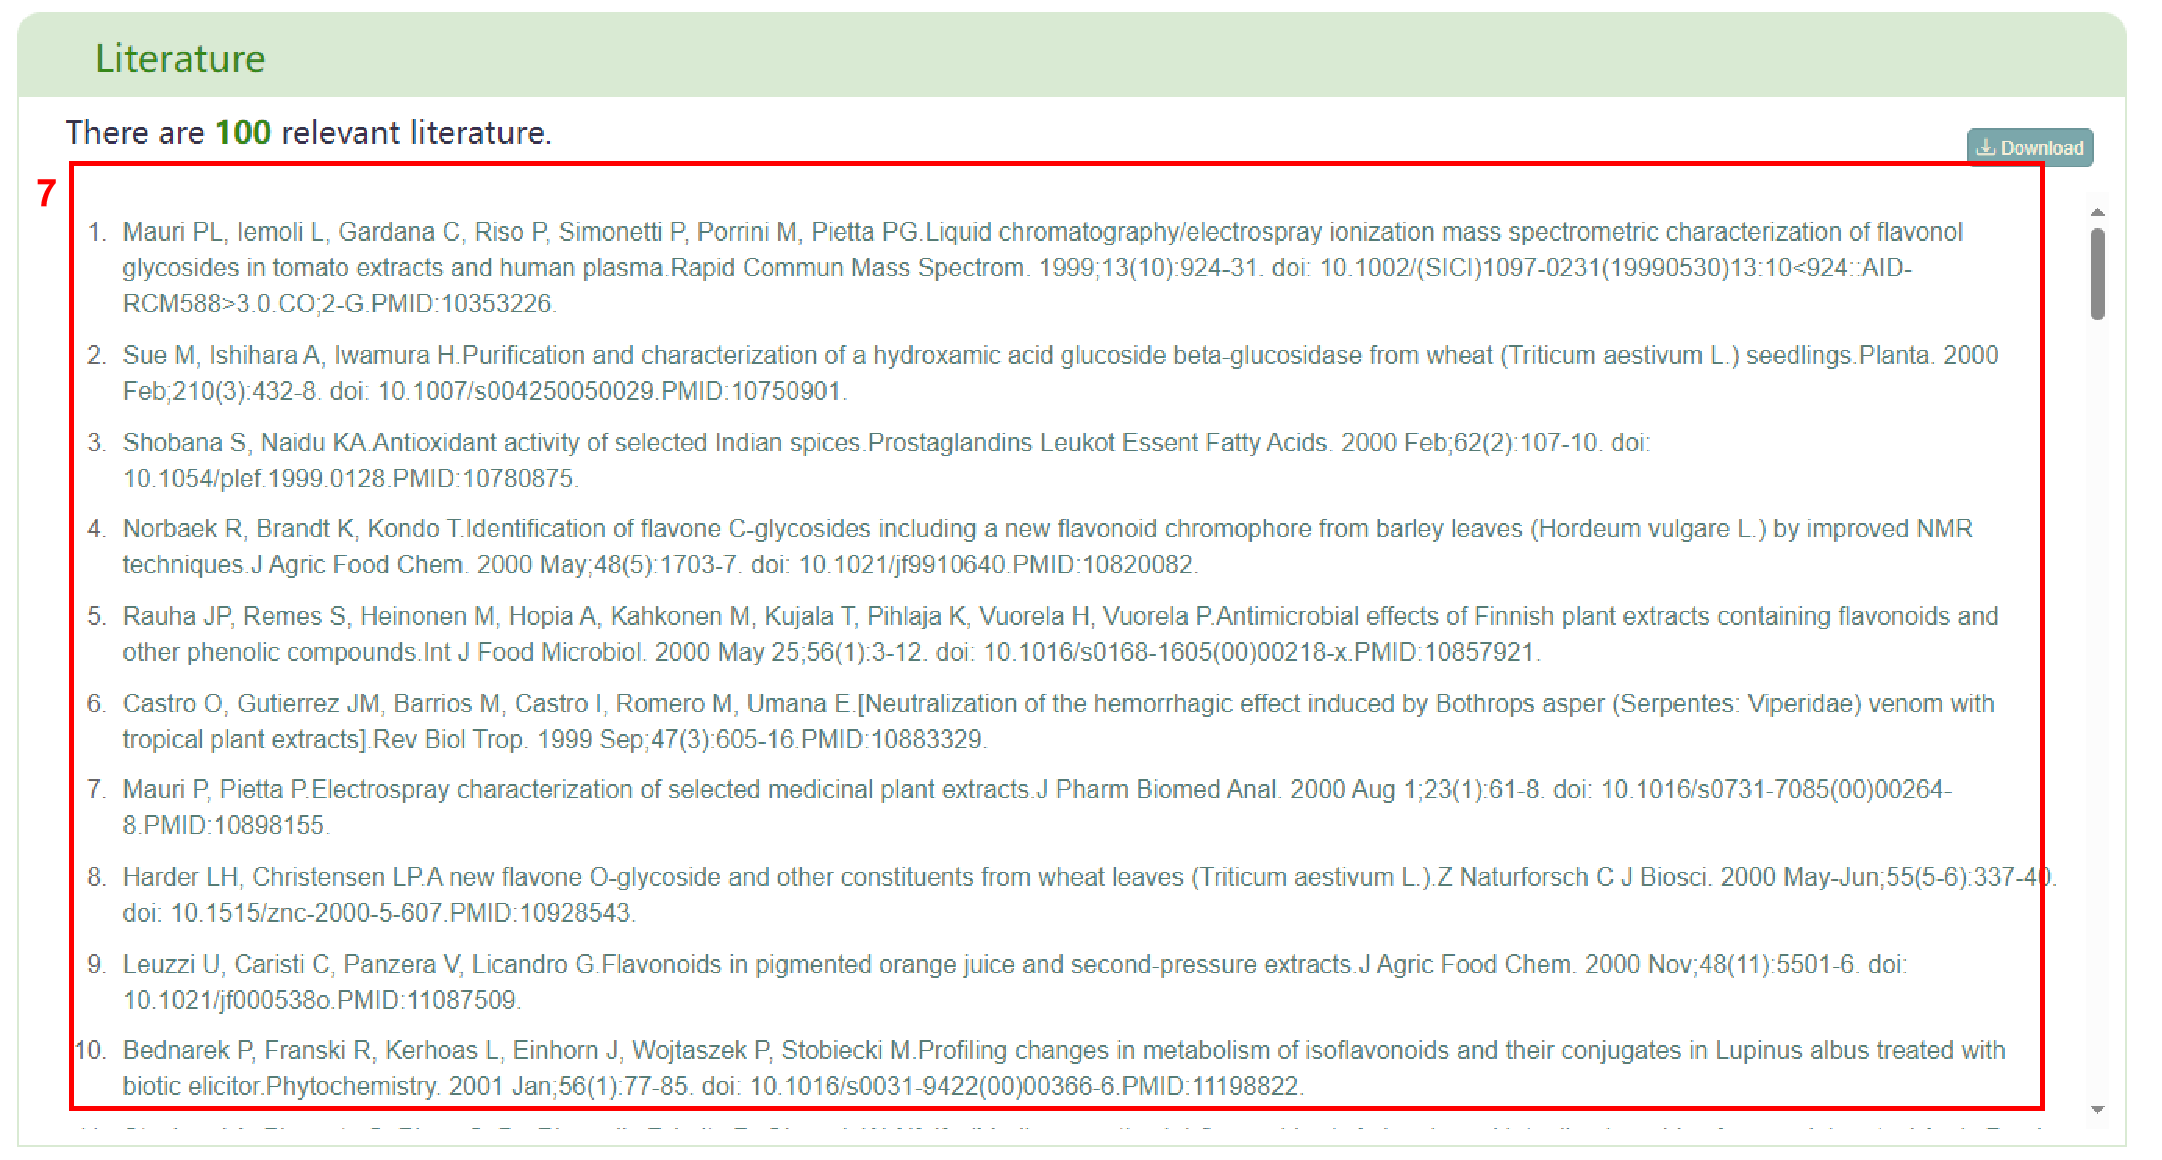
Next, users can view the distribution of the input metabolites in 530 species (box 4). In box 5, users can access the enrichment of metabolites in 530 species. By clicking the species name in the table, users can obtain the detailed page of species and hover the mouse on the bubble to display the name of the enriched species, the number of the enriched metabolites and the corresponding P-value (box 6). Finally, users can obtain the list of literature related to the input metabolites in box 7.
ID conversion
The “ID conversion” page provides the conversion of metabolite IDs between different databases. Next, this video explains how to use the “ID conversion” tool.
Alternatively, users can explore the tutorial below to learn about the functionality of this page.
The “ID conversion” page supports 17 databases for id conversion, including Biocyc, PubChem, CHEBI, KEGG, CAS, ChEMBL, MetanetX, NIKKAJI, KNApSAcK, 3DMET, ChemSpider, SEED, PDB-CCD, HMDB, BiGG, Metabolights, PMhub database.
Users first select the database of the input ID (box
1), enter the ID, or upload the file containing the ID (box 2), then select the target database
for ID conversion (box 3) and click the "Submit" button to obtain the related result.
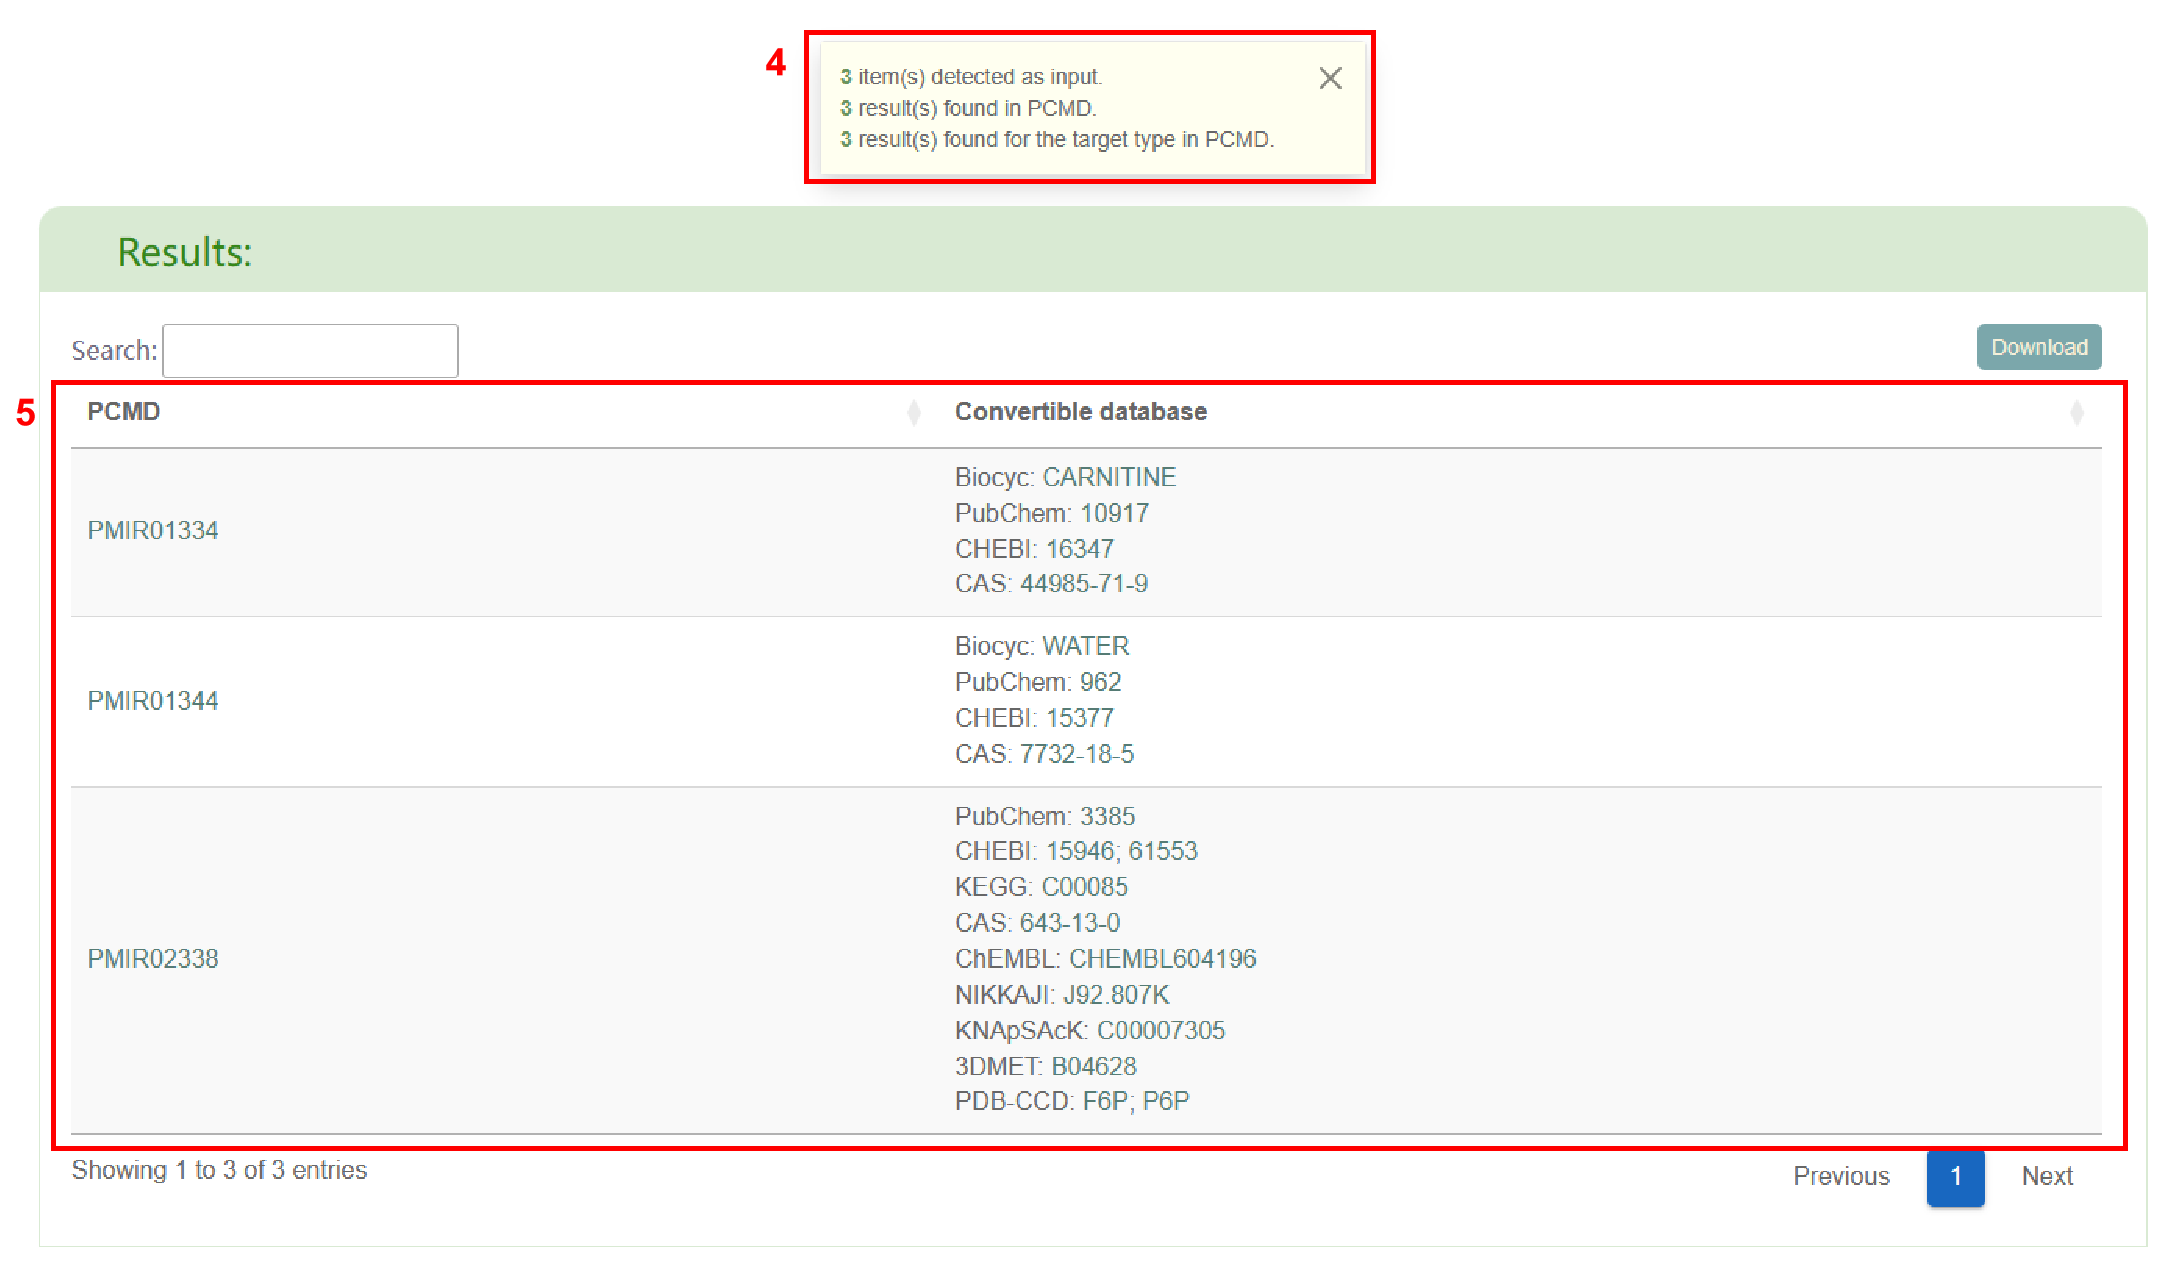
Firstly, PCMD displays the number of items entered, the number of results in PCMD, and the
number of results that meet the requirements in PCMD (box 4). Secondly, users can obtain the
list of ID conversion (box 5).

Metabolites-comparison
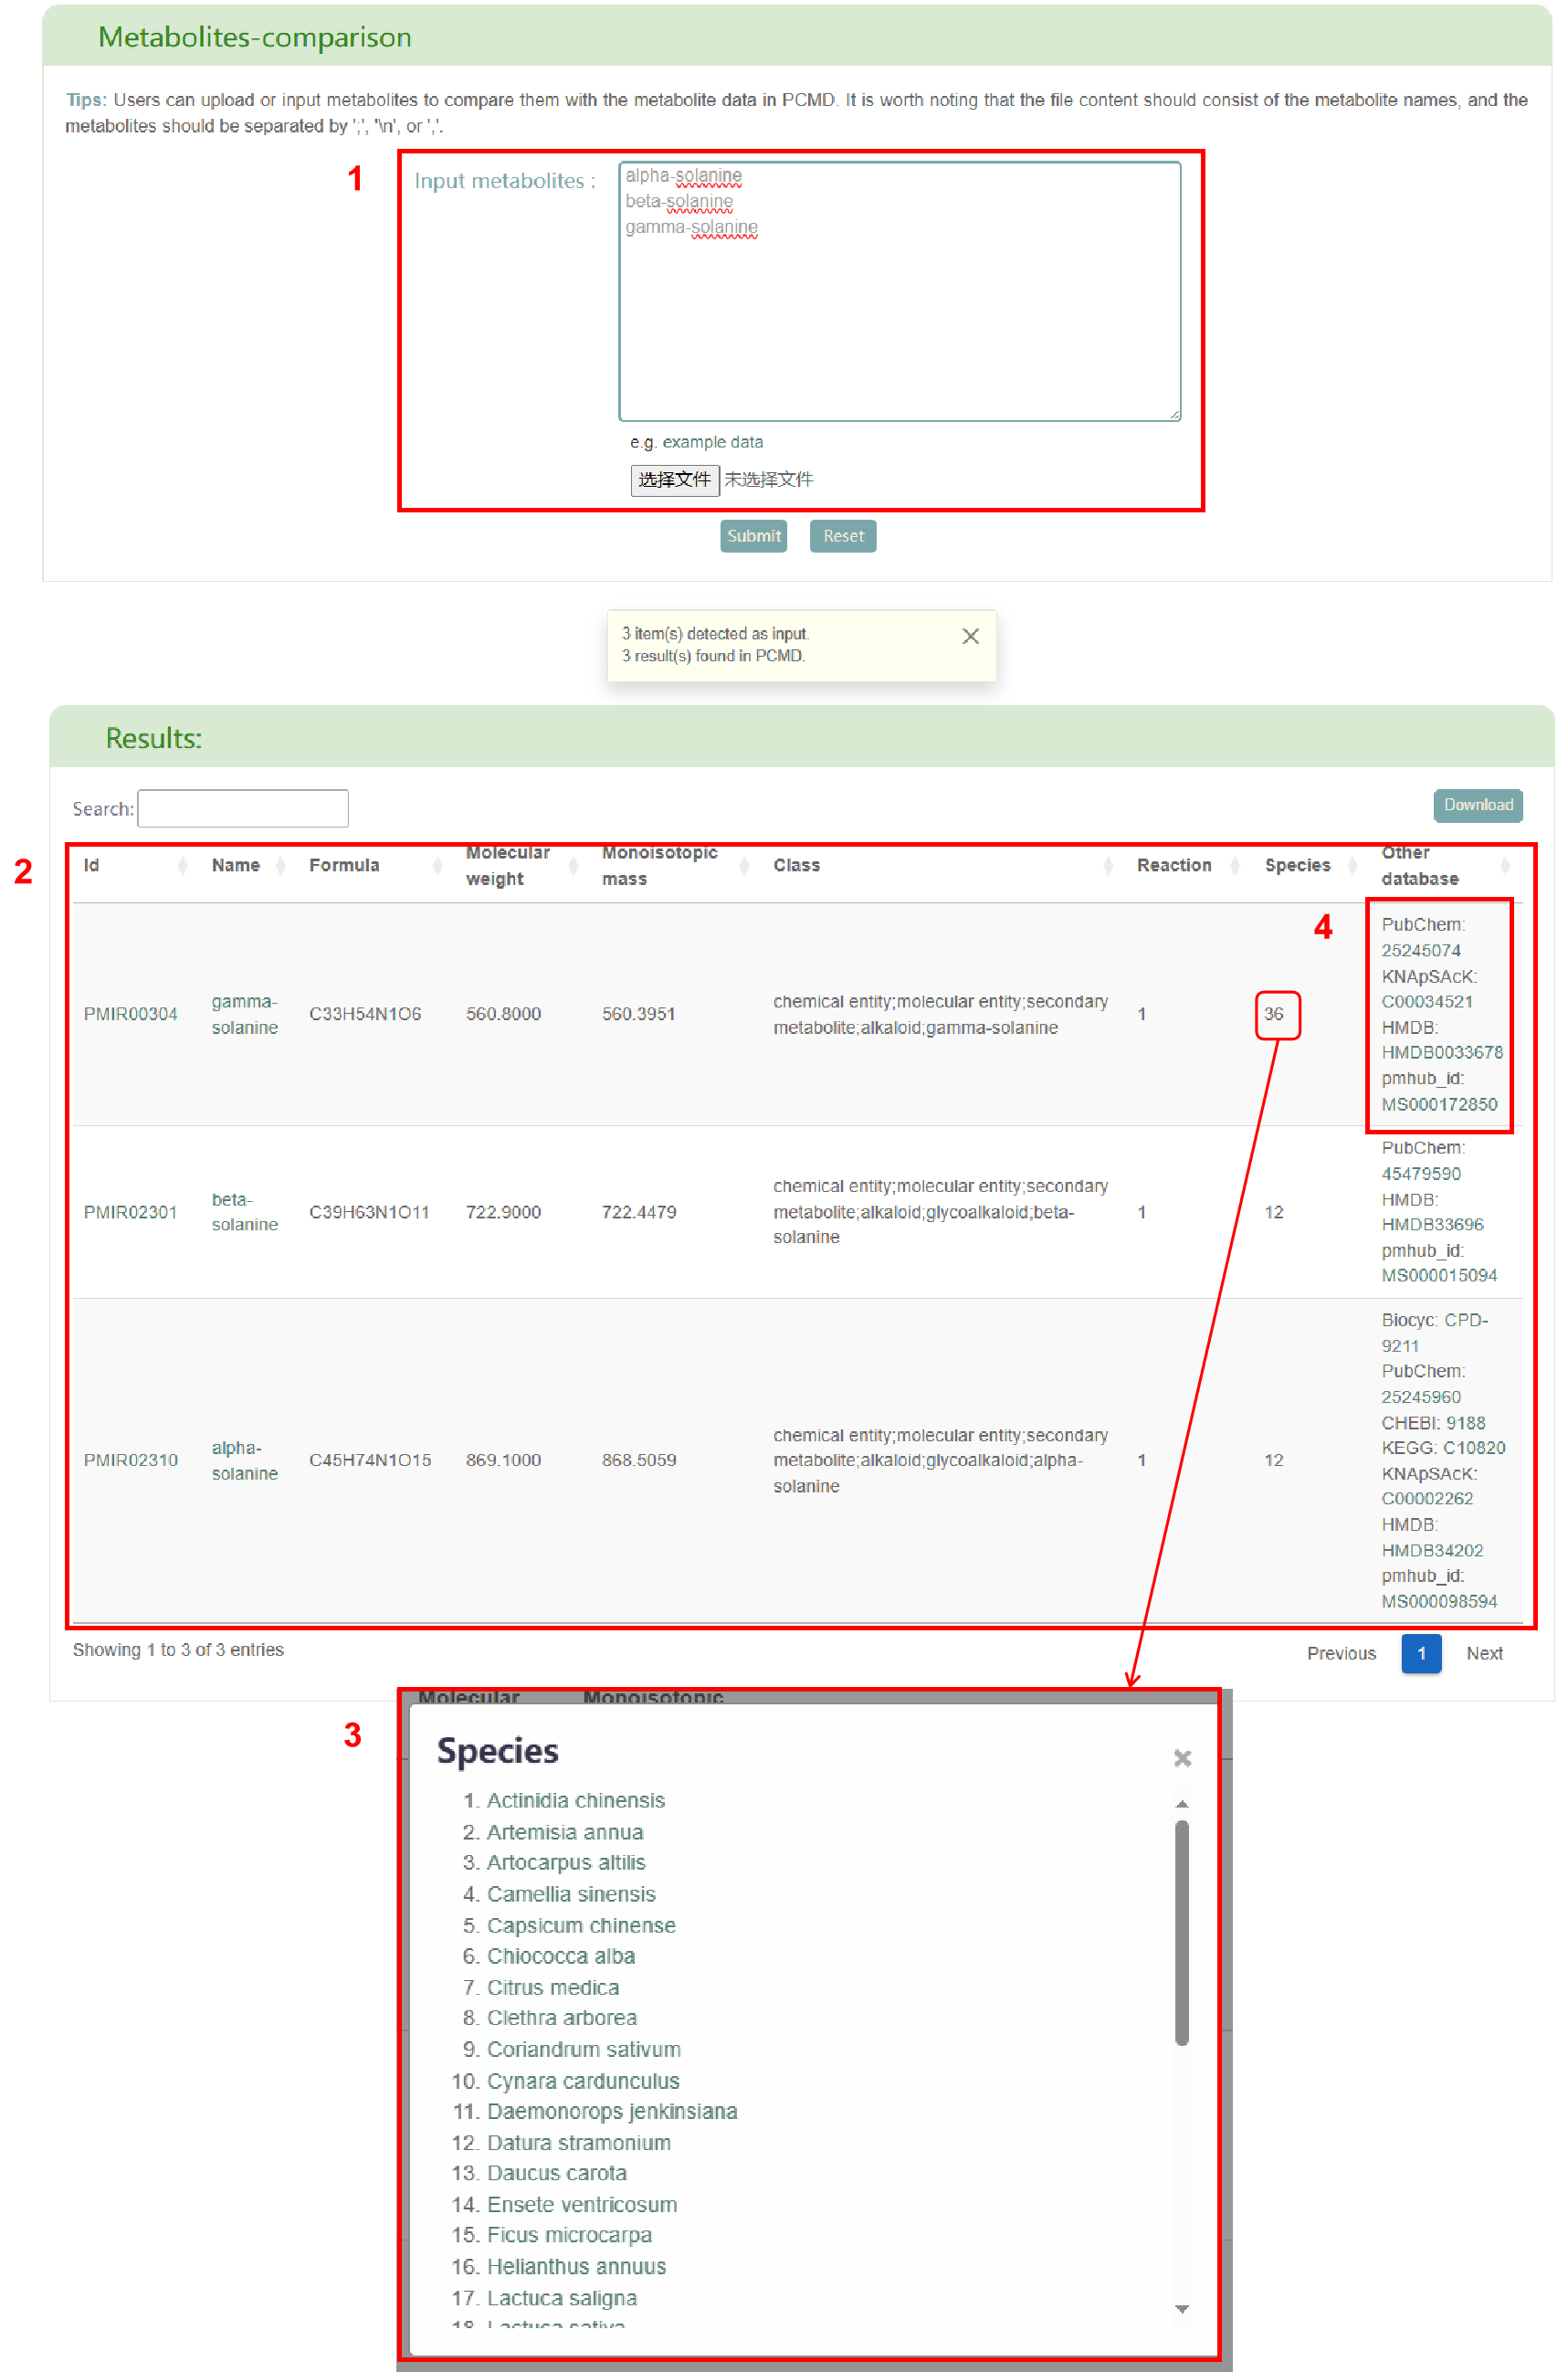
The "Metabolites-comparison" page supports comparison of metabolite data with data in PCMD to annotate metabolite data. Users can enter a set of metabolite names or upload a file containing metabolite names (box 1). After clicking submit, the page will display the basic information of the metabolites (ID, name, formula, molecular weight, monoisotopic mass, classification, number of participating reactions), distribution among 530 plant species and support from other databases (box 2). Among them, click on the number of plants to get all the plants containing the metabolite, and click on the plant name to jump to the corresponding plant details page (box 3). Click on any other database ID corresponding to the metabolite to jump to the corresponding page (box 4).
Reactions
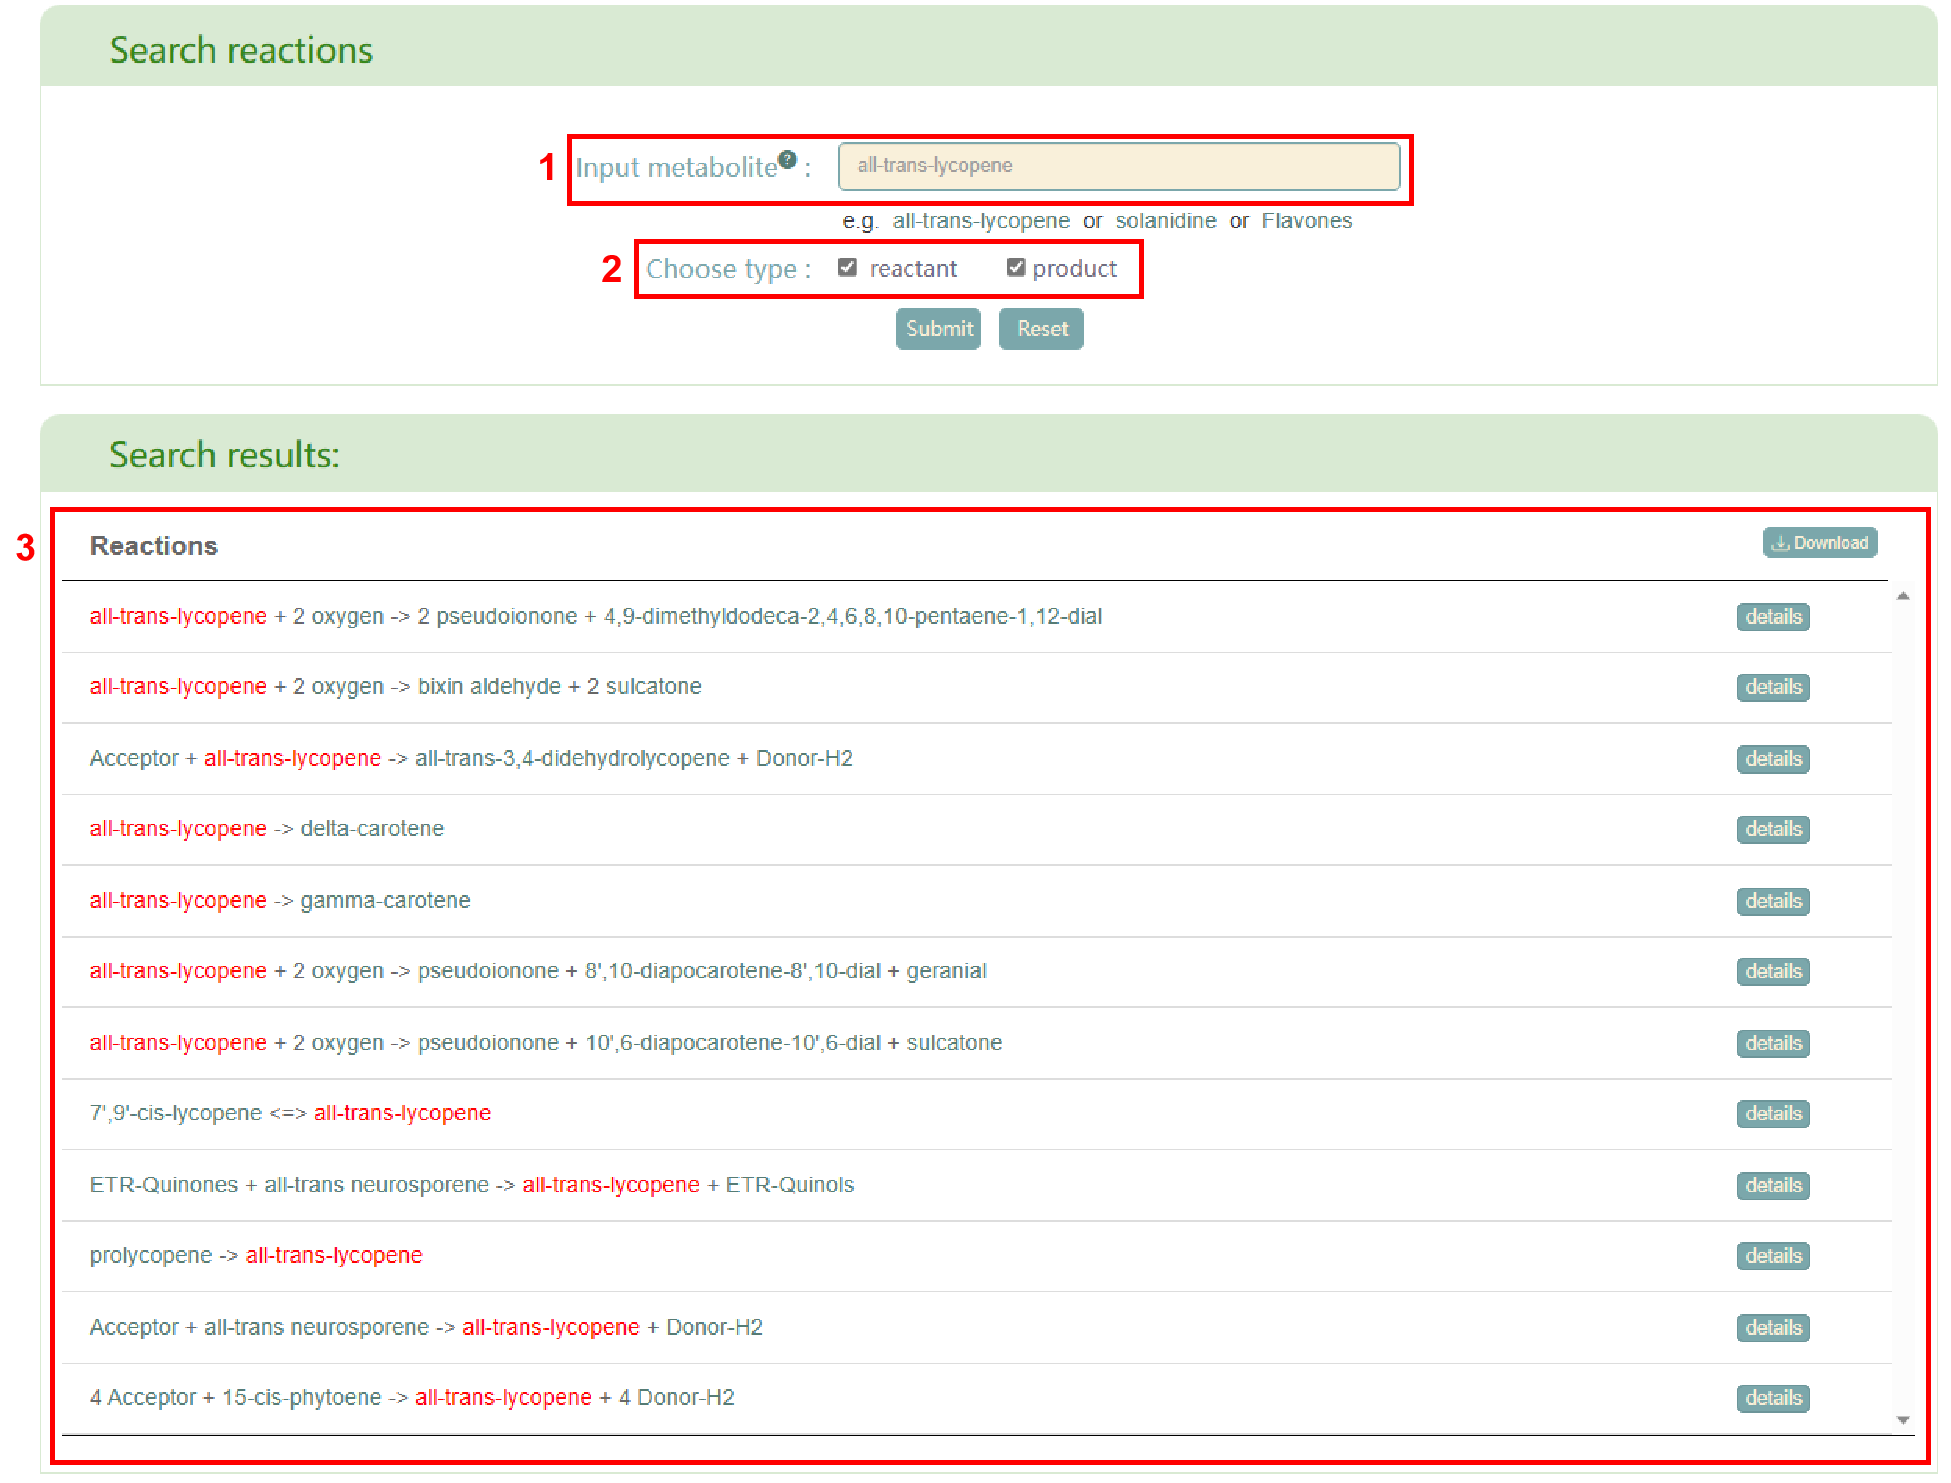
In the “Reactions” module, the page is mainly divided into two parts. In the “Search reactions” section, users can input the metabolite name (box 1), select the input metabolite as a reactant or product (box 2), and then click the "Submit" button to obtain reactions that meet their requirements (box 3). Furthermore, users can access the reaction’s detail page by clicking the “details” button.
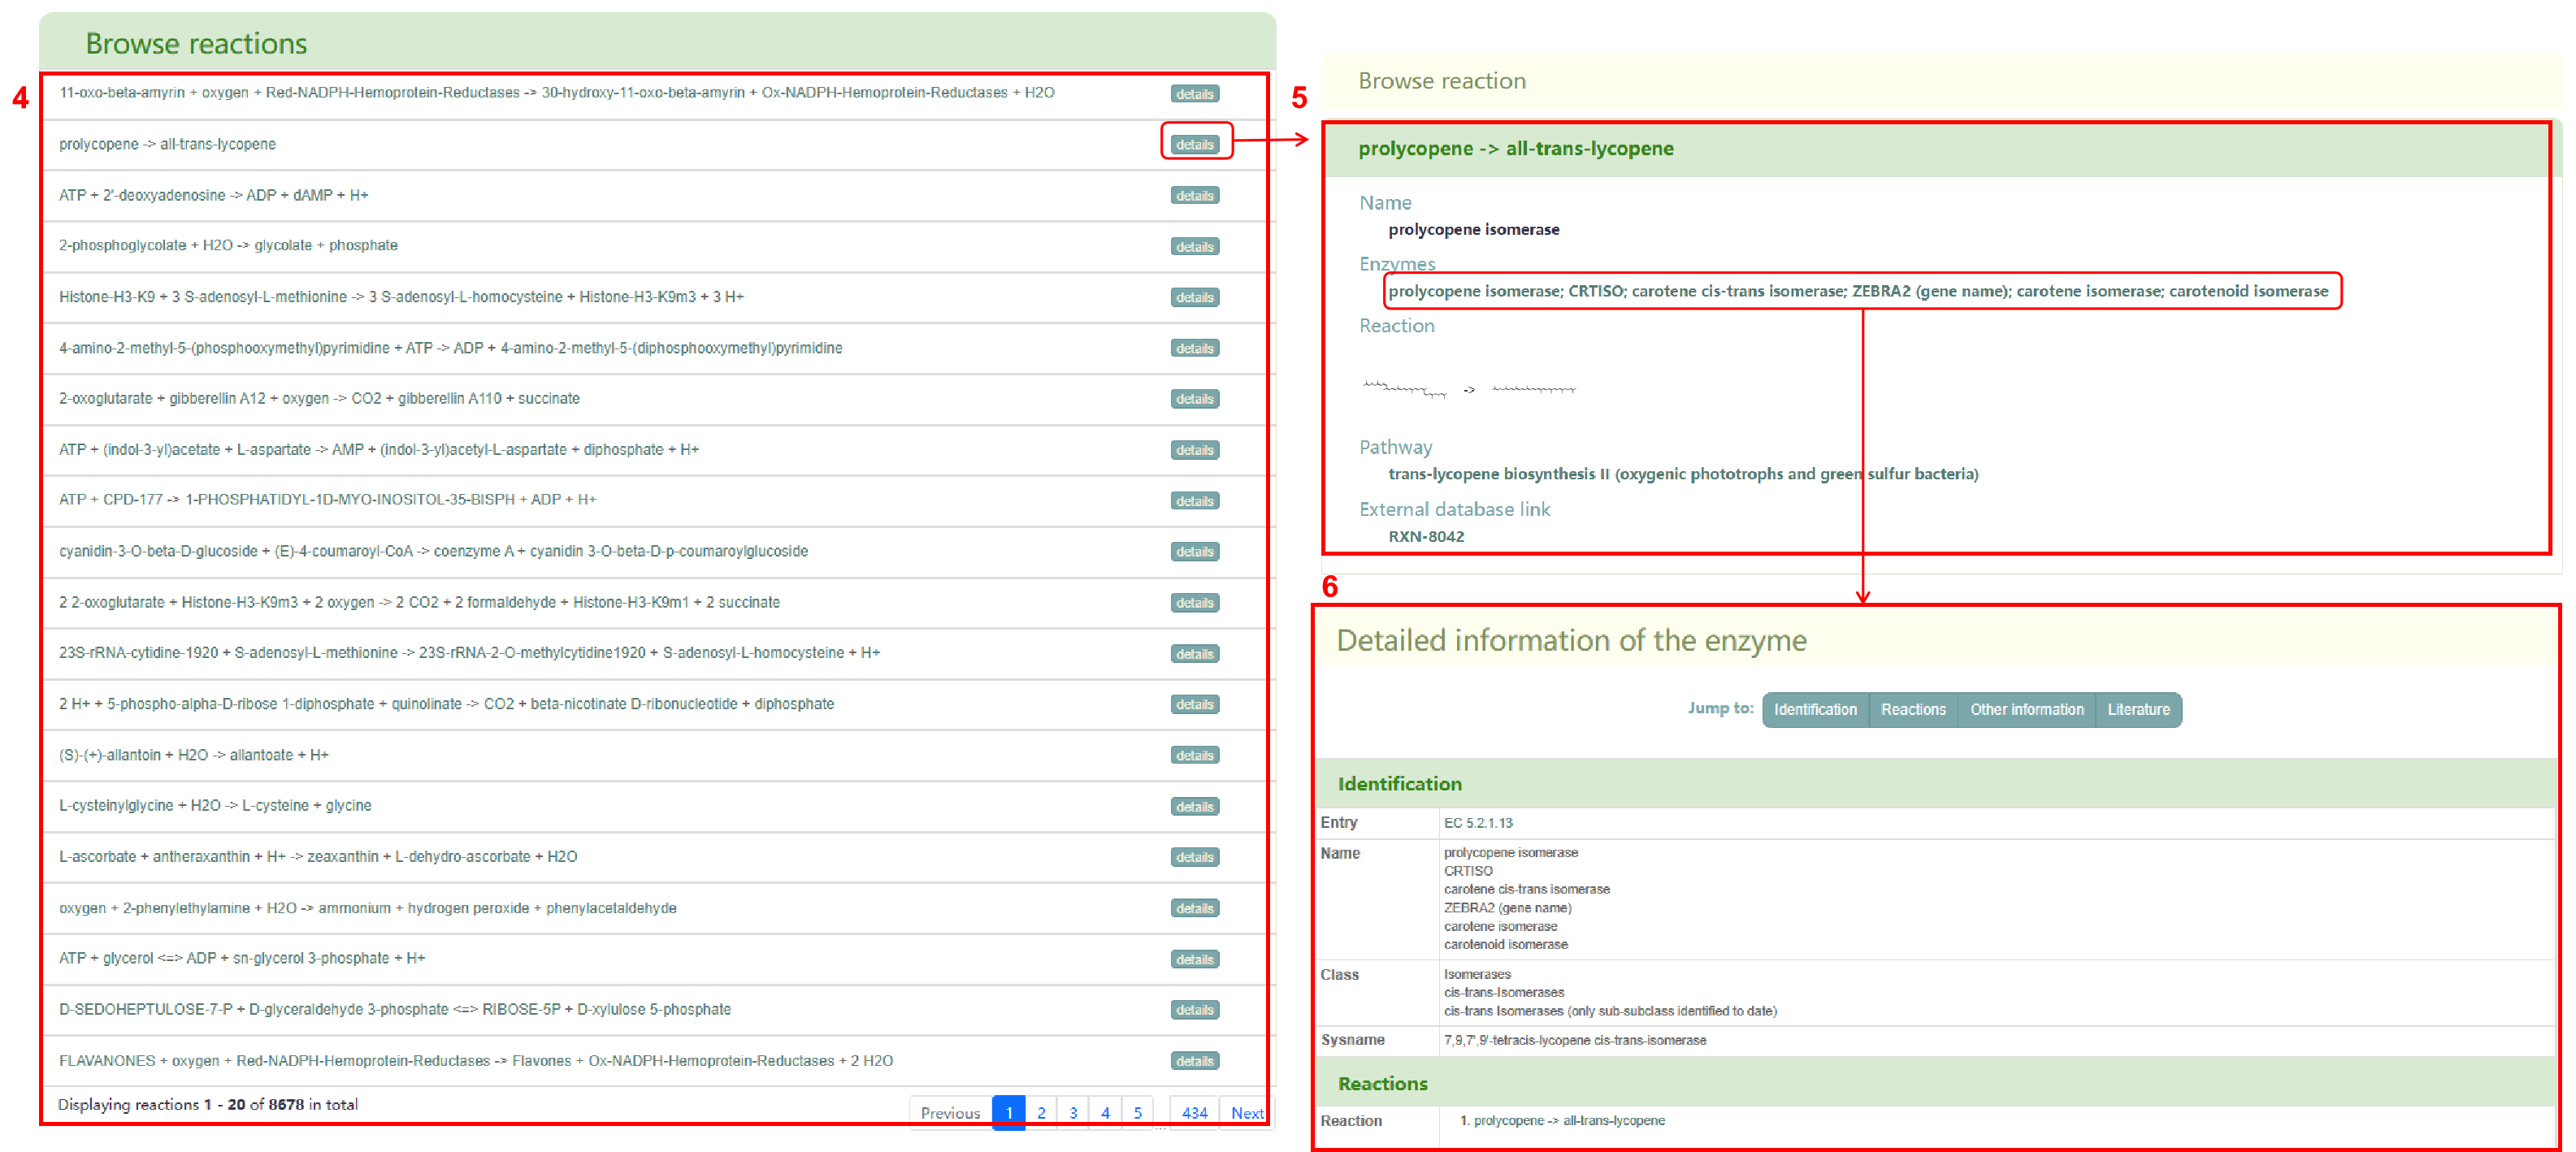
The second section is “Browse reaction” (box4), which displays all the reactions in PCMD. Users can click on the metabolite in the reaction to jump to the detailed page. By clicking the "details" button, users can access the basic information of the reaction, including the equation name, enzyme, pathway, and links to the equation in other databases (box 5). Additionally, users can click on the enzyme name to jump to the corresponding enzyme details page (box 6) and click on the link of pathway and other databases to jump to the corresponding page.
Literature
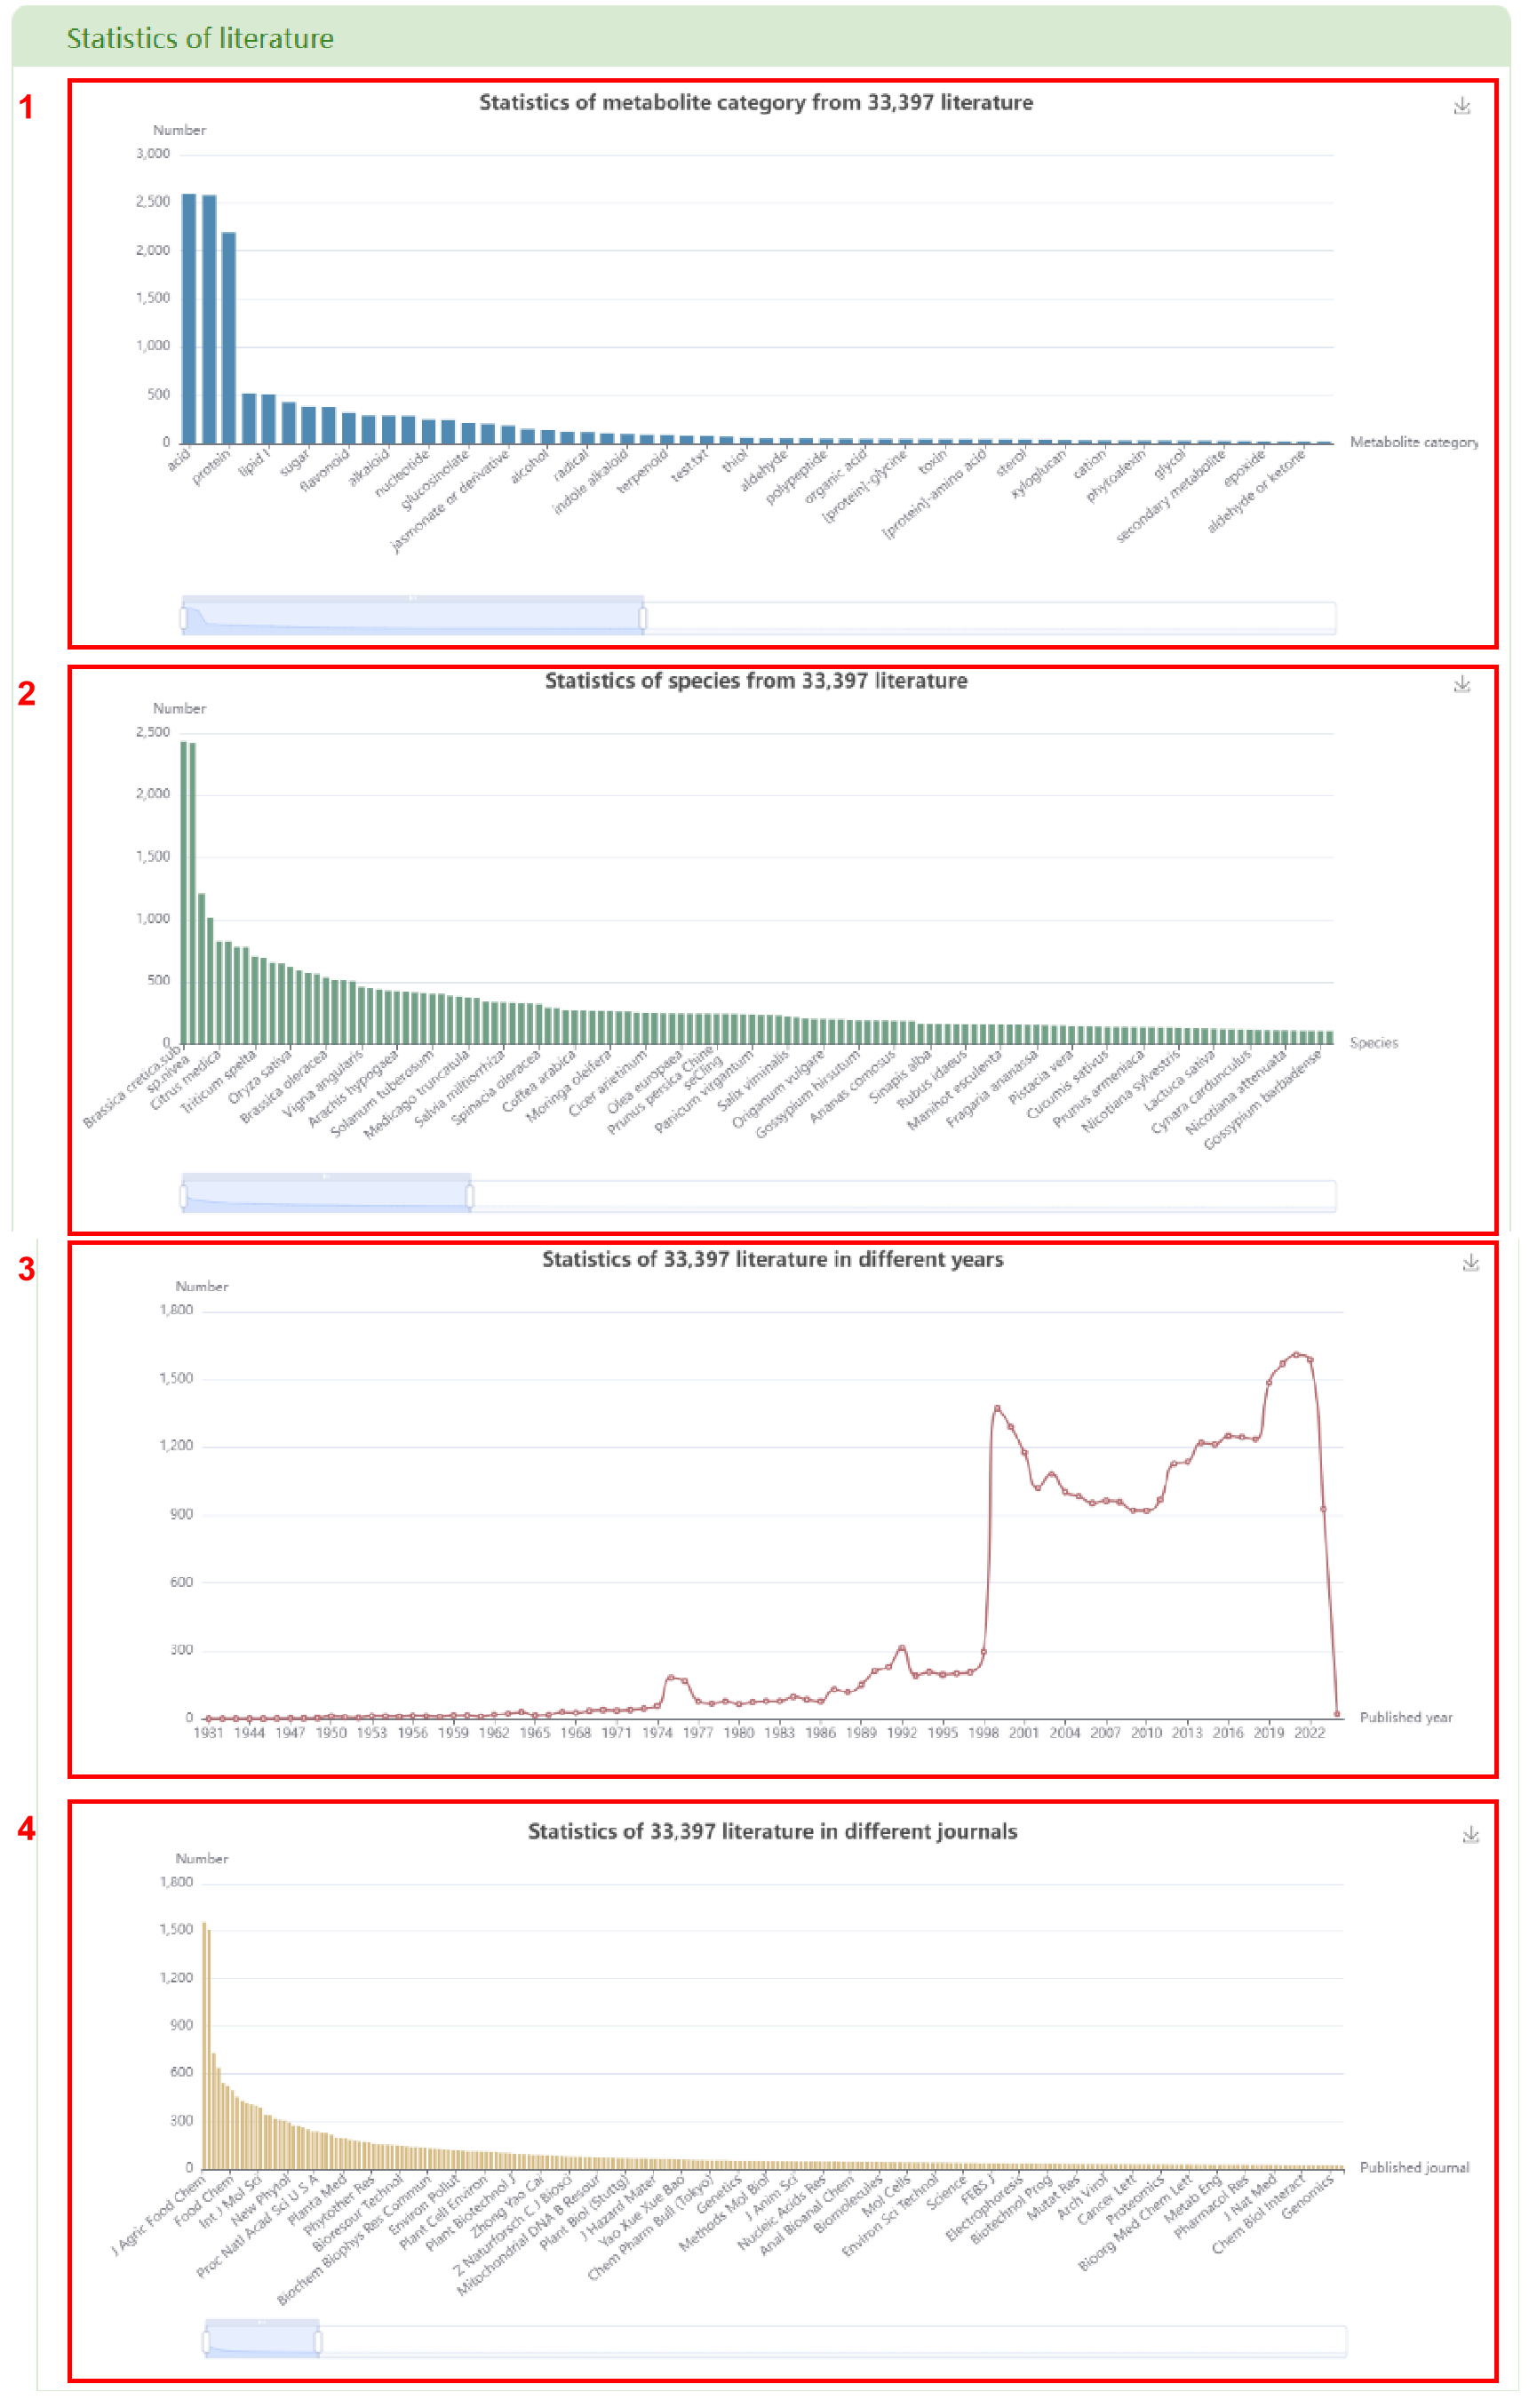
In the “Literature” module, this page is divided into two parts: Statistics of literature and Literature search. In the “Statistics of literature” section, users can obtain the statistics of all literature about metabolites category (box 1), 530 species (box 2), published year (box 3) and published journals (box 4). By clicking on the bar chart and line chart, a list of the related literature information will be displayed.
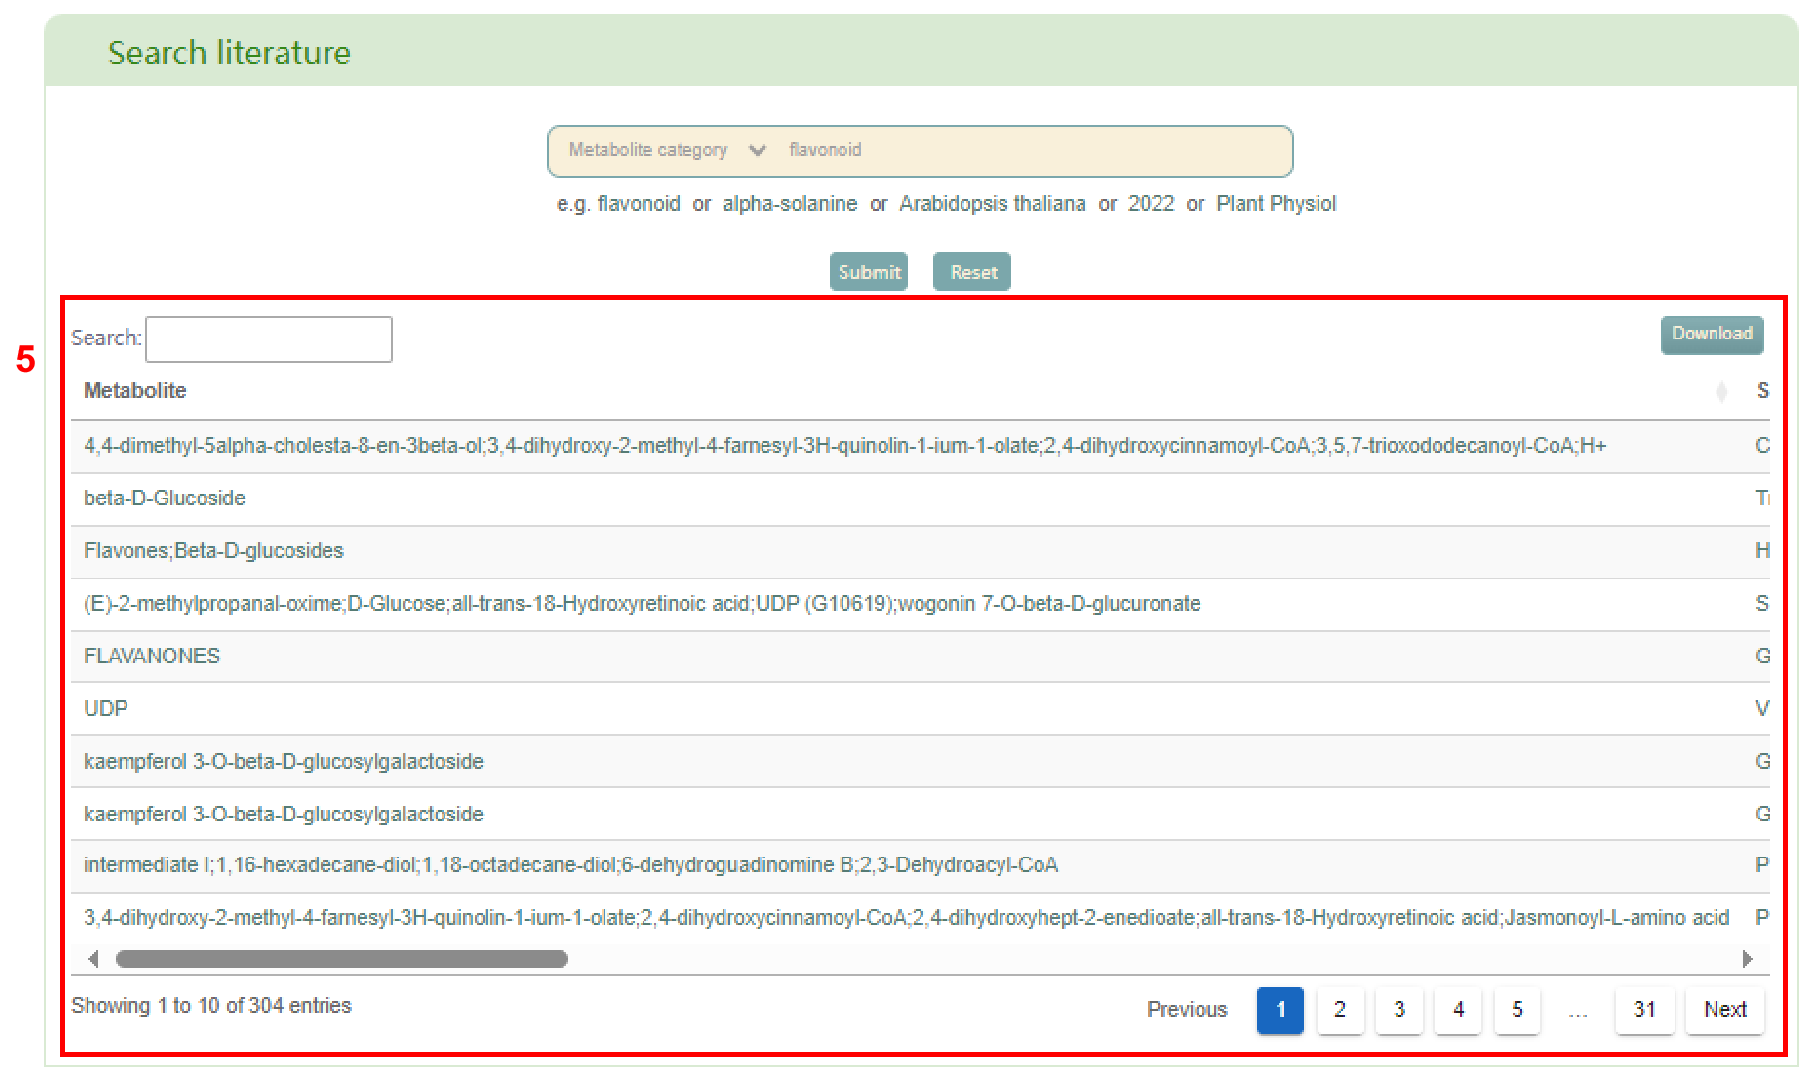
In the “Search literature” section, users can select an option: “Metabolite”, “Metabolite category”, “Species”, “Published year” or “Published journal”, after that click the "Submit" button to obtain the related result. The search result is a list of the literature information in PCMD that meets user’s requirements (box 5). Additionally, users can access the PubMed page of literature by clicking on the title of the literature.
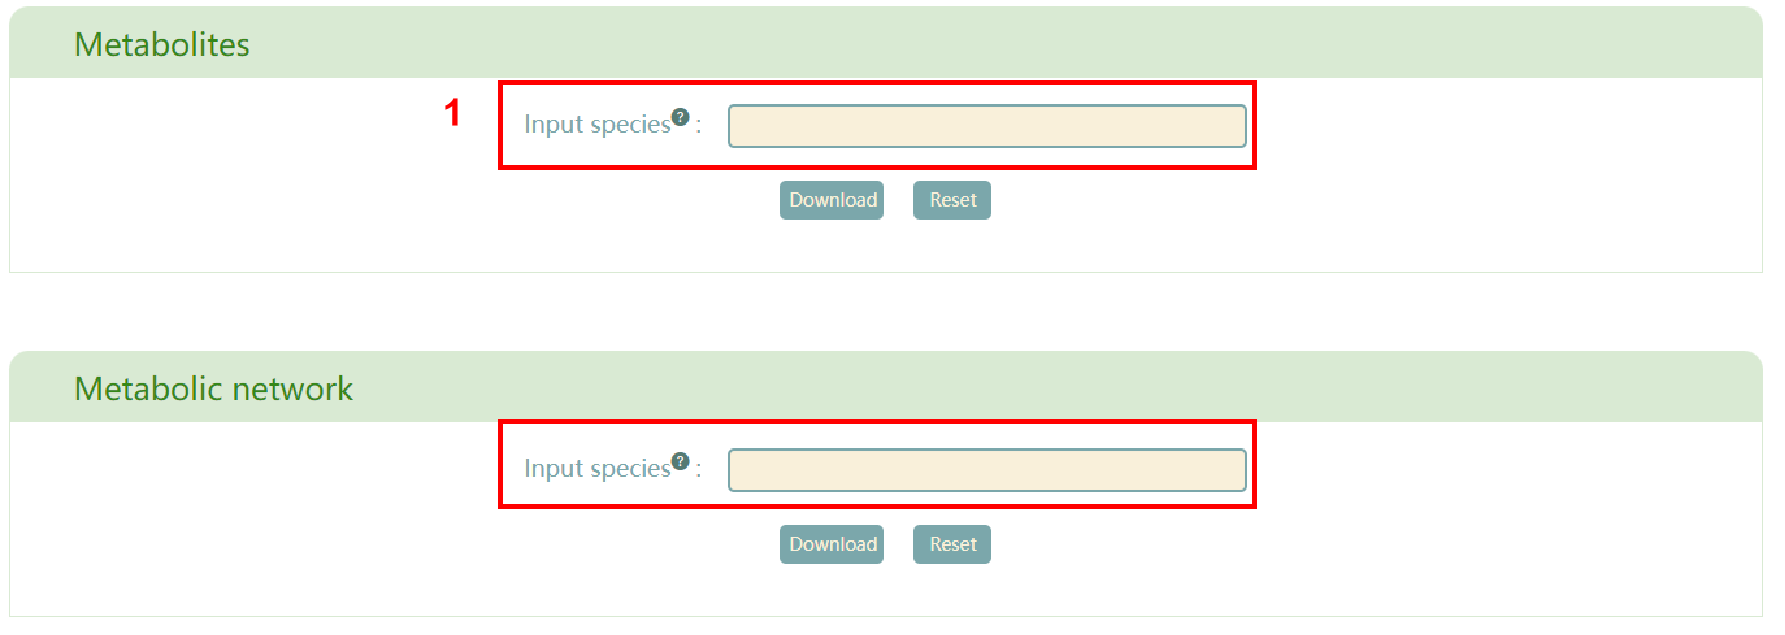
Download
The “Download” module currently supports three types of data download: metabolites and metabolic network. To access the data, users can input the species (box 1) and click the "Download" button.