CottonMD
A Multiomics Database for cotton biological study
eg: MORF5 or AT2G40190 or Ghi_A08G06586
0 Overview
CottonMD (Cotton Multiomics Database, http://yanglab.hzau.edu.cn/CottonMD) is a pangenome-based cotton multi-omics database.
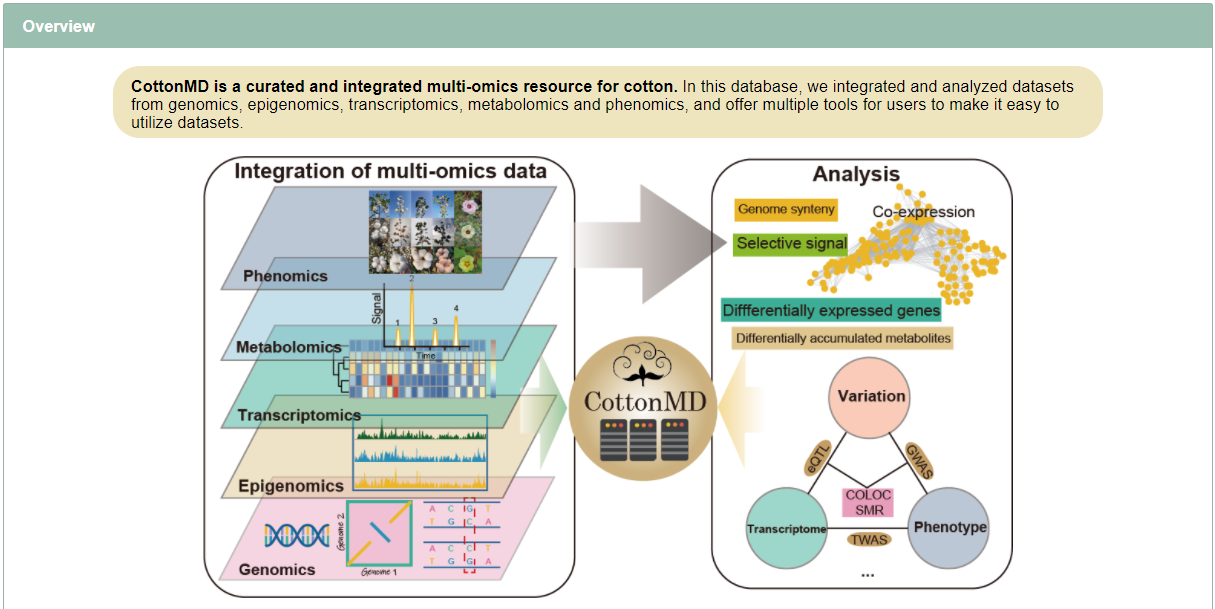
Here, we firstly constructed a genetic variation panel of a large-scale cotton population comprising of 4,180 accessions. Then, we built a cotton pangenome with 146,881 gene clusters for 1,521,966 genes from 25 cotton genome assemblies. Based on this pangenome, we established a pangenome-based multiomics database (designated as CottonMD) by mining and integrating the data of 25 genomes, transcriptomes (from 76 tissues and 240 individuals), genetic variations (from 4,180 accessions), phenotypic data (from 21 phenotypes), epigenomes (from six germplasms) and 768 metabolites (from four tissues).
CottonMD provides a large amount of multiomic data and easy-to-use search tools, which will be a valuable database for future cotton genetic breeding and functional genomics research.
1 Homepage
1.1 The Top Menu
The top navigation menu gathers general functions of the database, including links to different modules and tools, and smart search.
1.2 Brief introduction of CottonMD and construction pipeline of CottonMD through integration of multiomics data
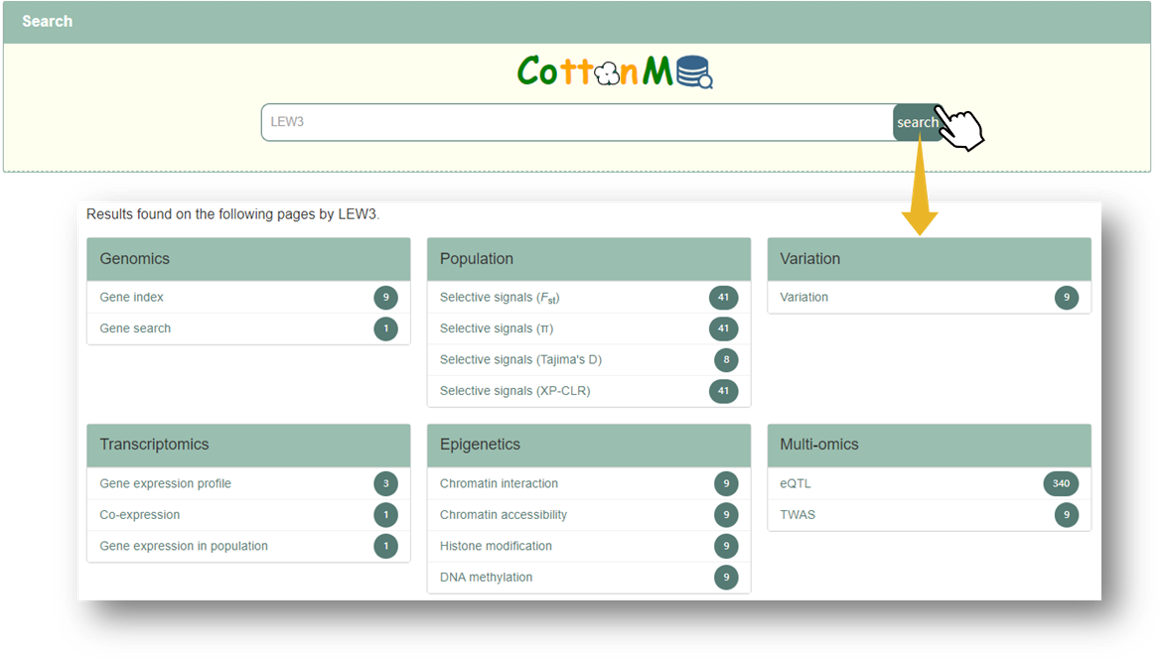
1.3 Smart search
For smart search, input of gene ID of 25 cotton genomes, gene ID and name of Arabidopsis and genomic region are supported.
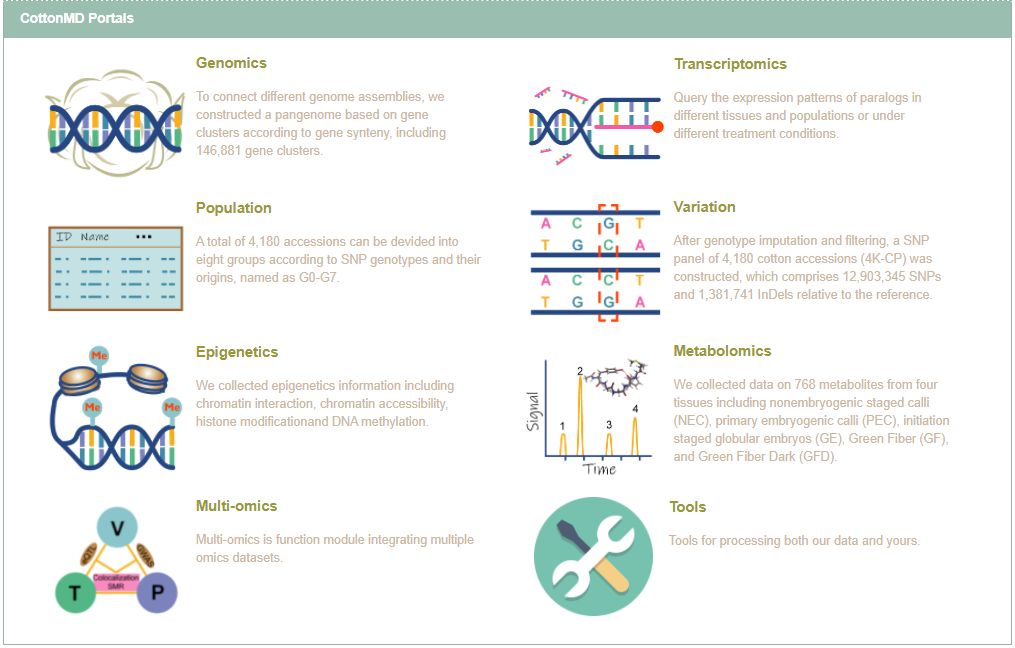
1.4 Quick entry of function module
2 Genomics module
2.1 Genome synteny
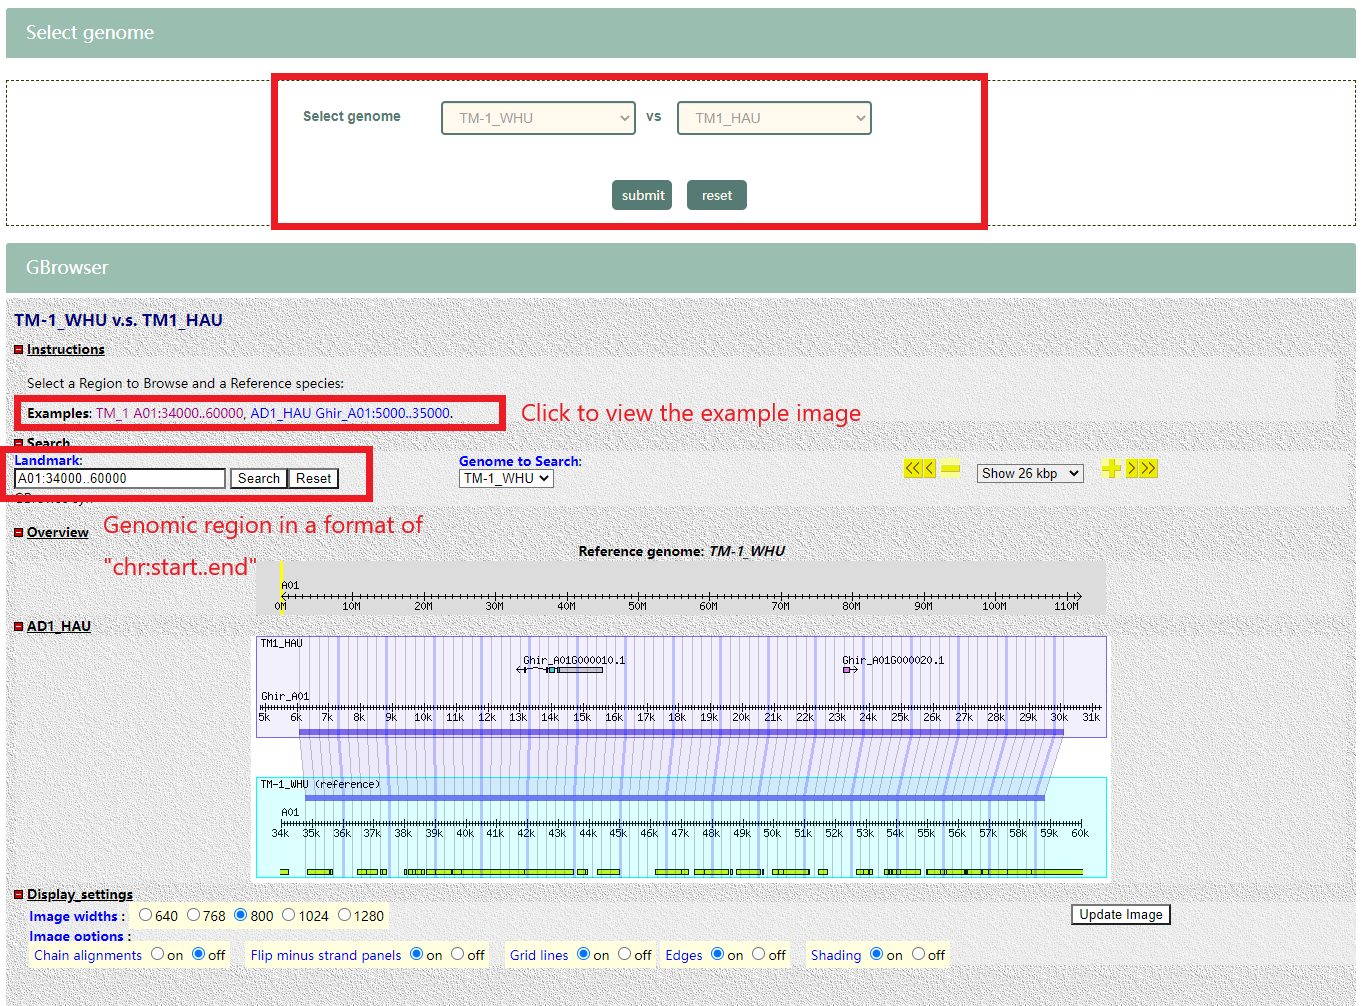
Genome synteny module contains two pages, user can browse local alignment by GBrowse, and browse genome alignment by Dotplots at global level.

2.1.1 Gbrowser
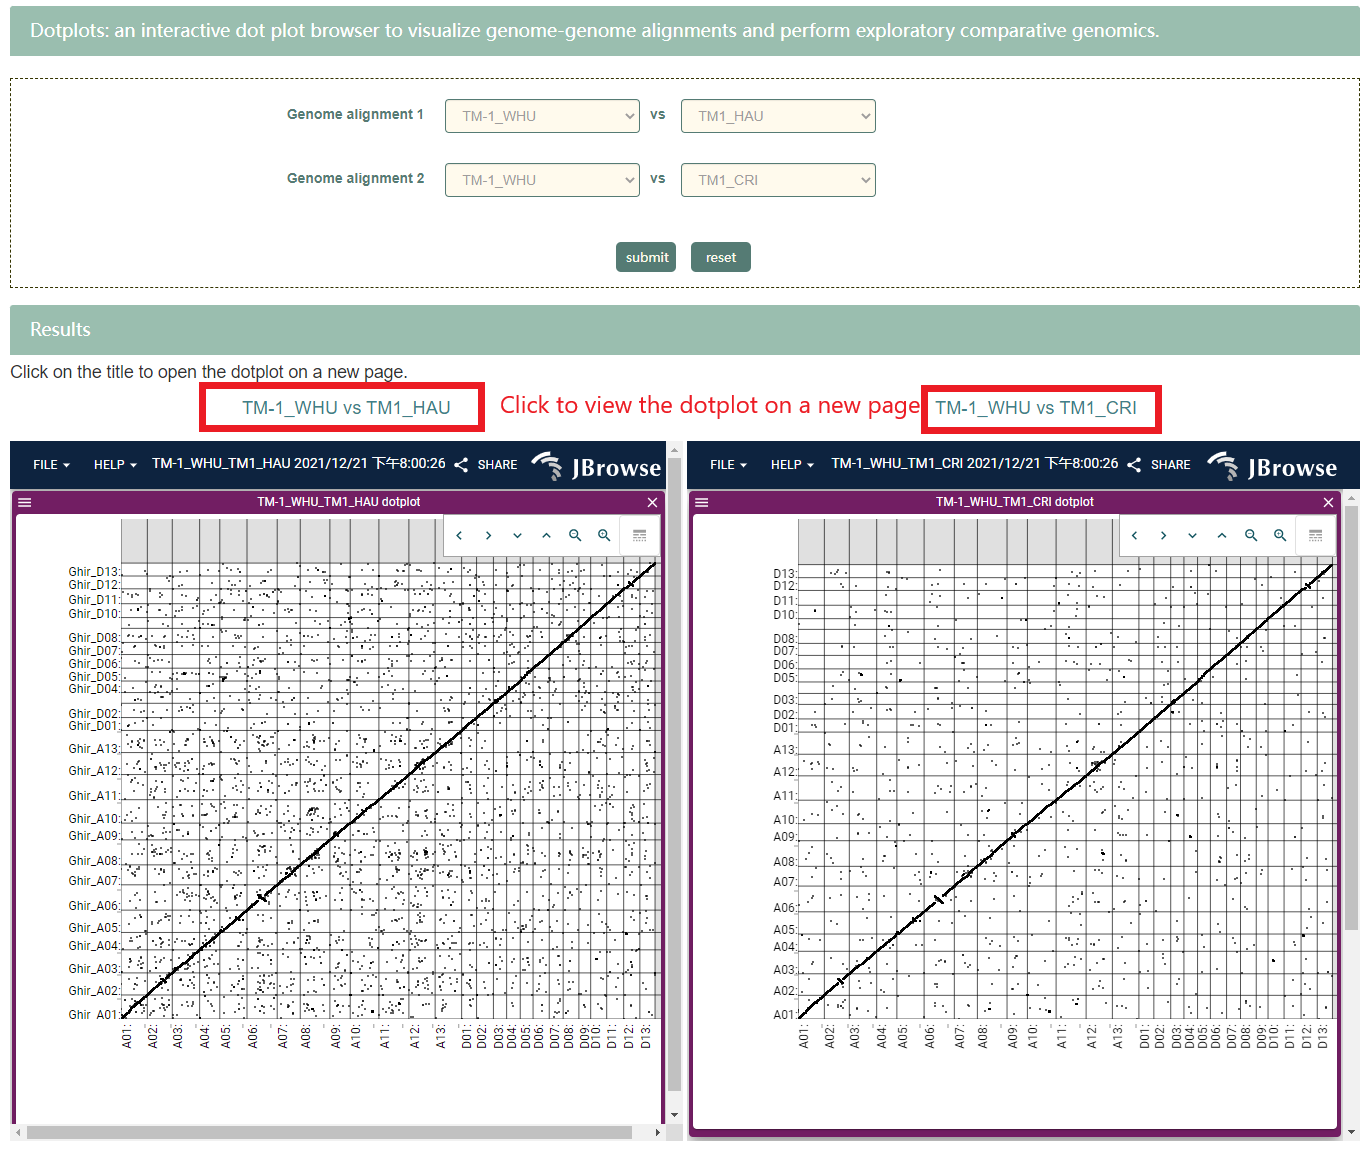
2.1.2 Dotplots
2.2 Gene index
1,521,966 genes of 25 genome assemblies were used to construct the gene index. Gene synteny of every pairs from 25 genome assemblies were detected by McScanX. Finally, 146,881 gene clusters were identified as the gene index of cotton. All gene indexes were functionally annotated based on the with homology with A. thaliana. The gene clusters with the same A. thaliana gene were merged. Finally, 146,881 gene clusters were left as the gene indexes in cotton. User can search the interested gene index and browse syntenic genes and their functions by inputting gene ID.
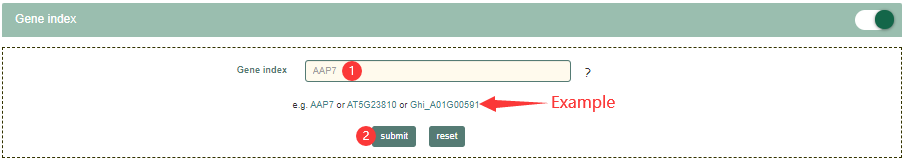
2.2.1 Input
Steps for usage:
Step1: Enter your search value. gene name and gene ID of 25 published cotton and Arabidopsis genomes are supported.
Step2: Get search results.
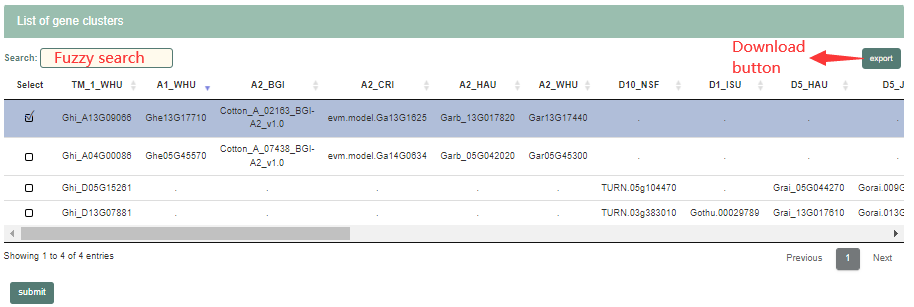
2.2.2 Result page
Part1: List of gene clusters. The user can select the gene clusters of interest.
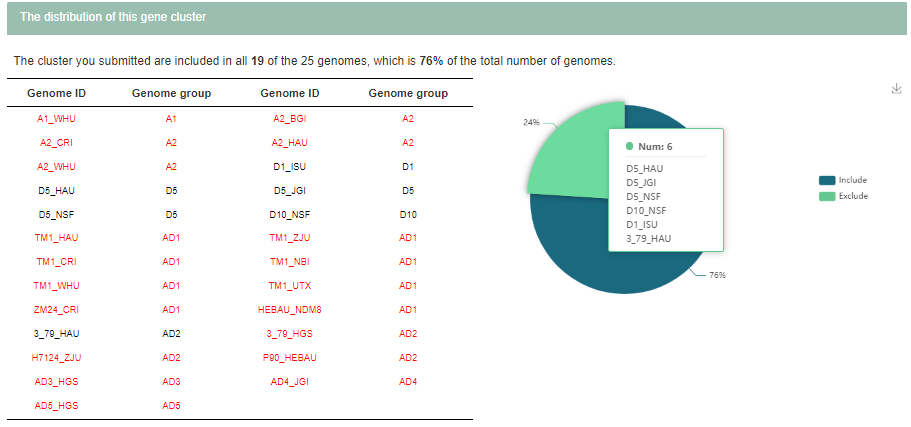
Part2: The distribution of this gene cluster.
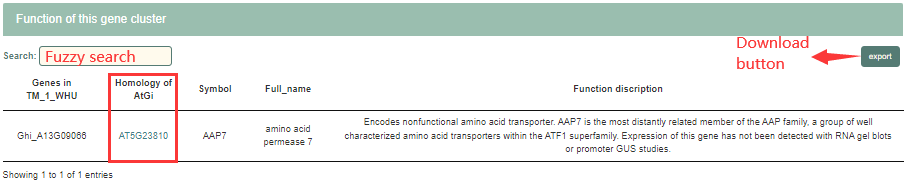
Part3: Function of this gene cluster. Users can jump to TAIR by clicking on the Arabidopsis gene.
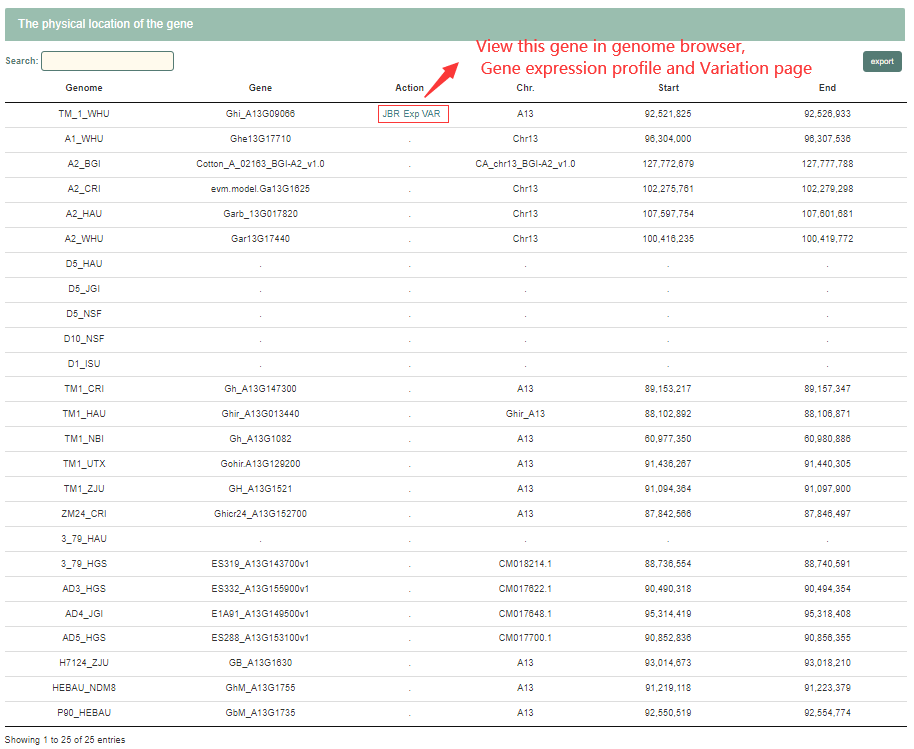
Part4: The physical location of the gene.
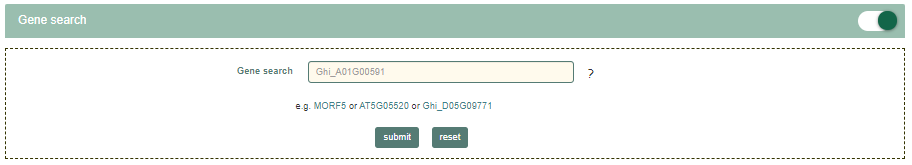
2.3 Gene search
1,521,966 genes of 25 genome assemblies were included in cottonMD. All genes were functionally annotated based on their homologies with the genes in A. thaliana. User can search the functions of interested genes by inputting gene ID.
2.3.1 Input
gene name and gene ID of 25 published cotton and Arabidopsis genomes are supported.
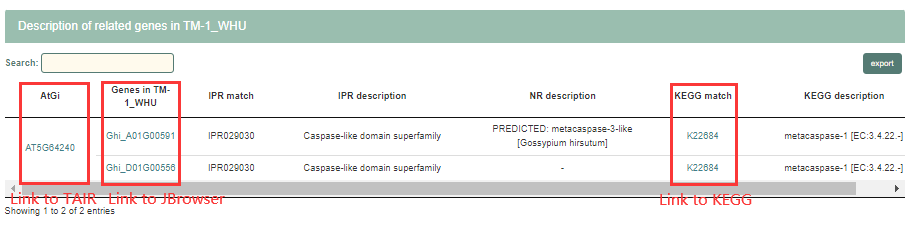
2.3.2 Result page
Part1: Function of related gene clusters. Users can jump to TAIR by clicking on the Arabidopsis gene.

Part2: Phylogenetic tree of orthologs genes of TM-1_WHU and Arabidopsis.
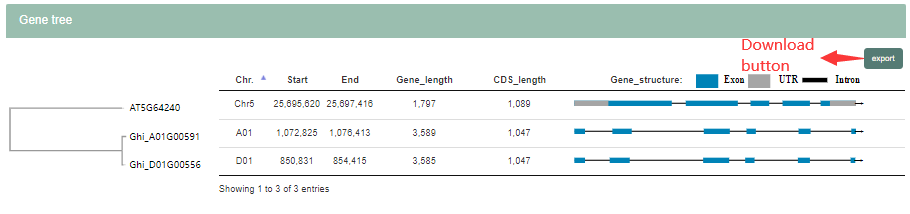
Part3: Description of related genes in TM-1_WHU.
3 Population module
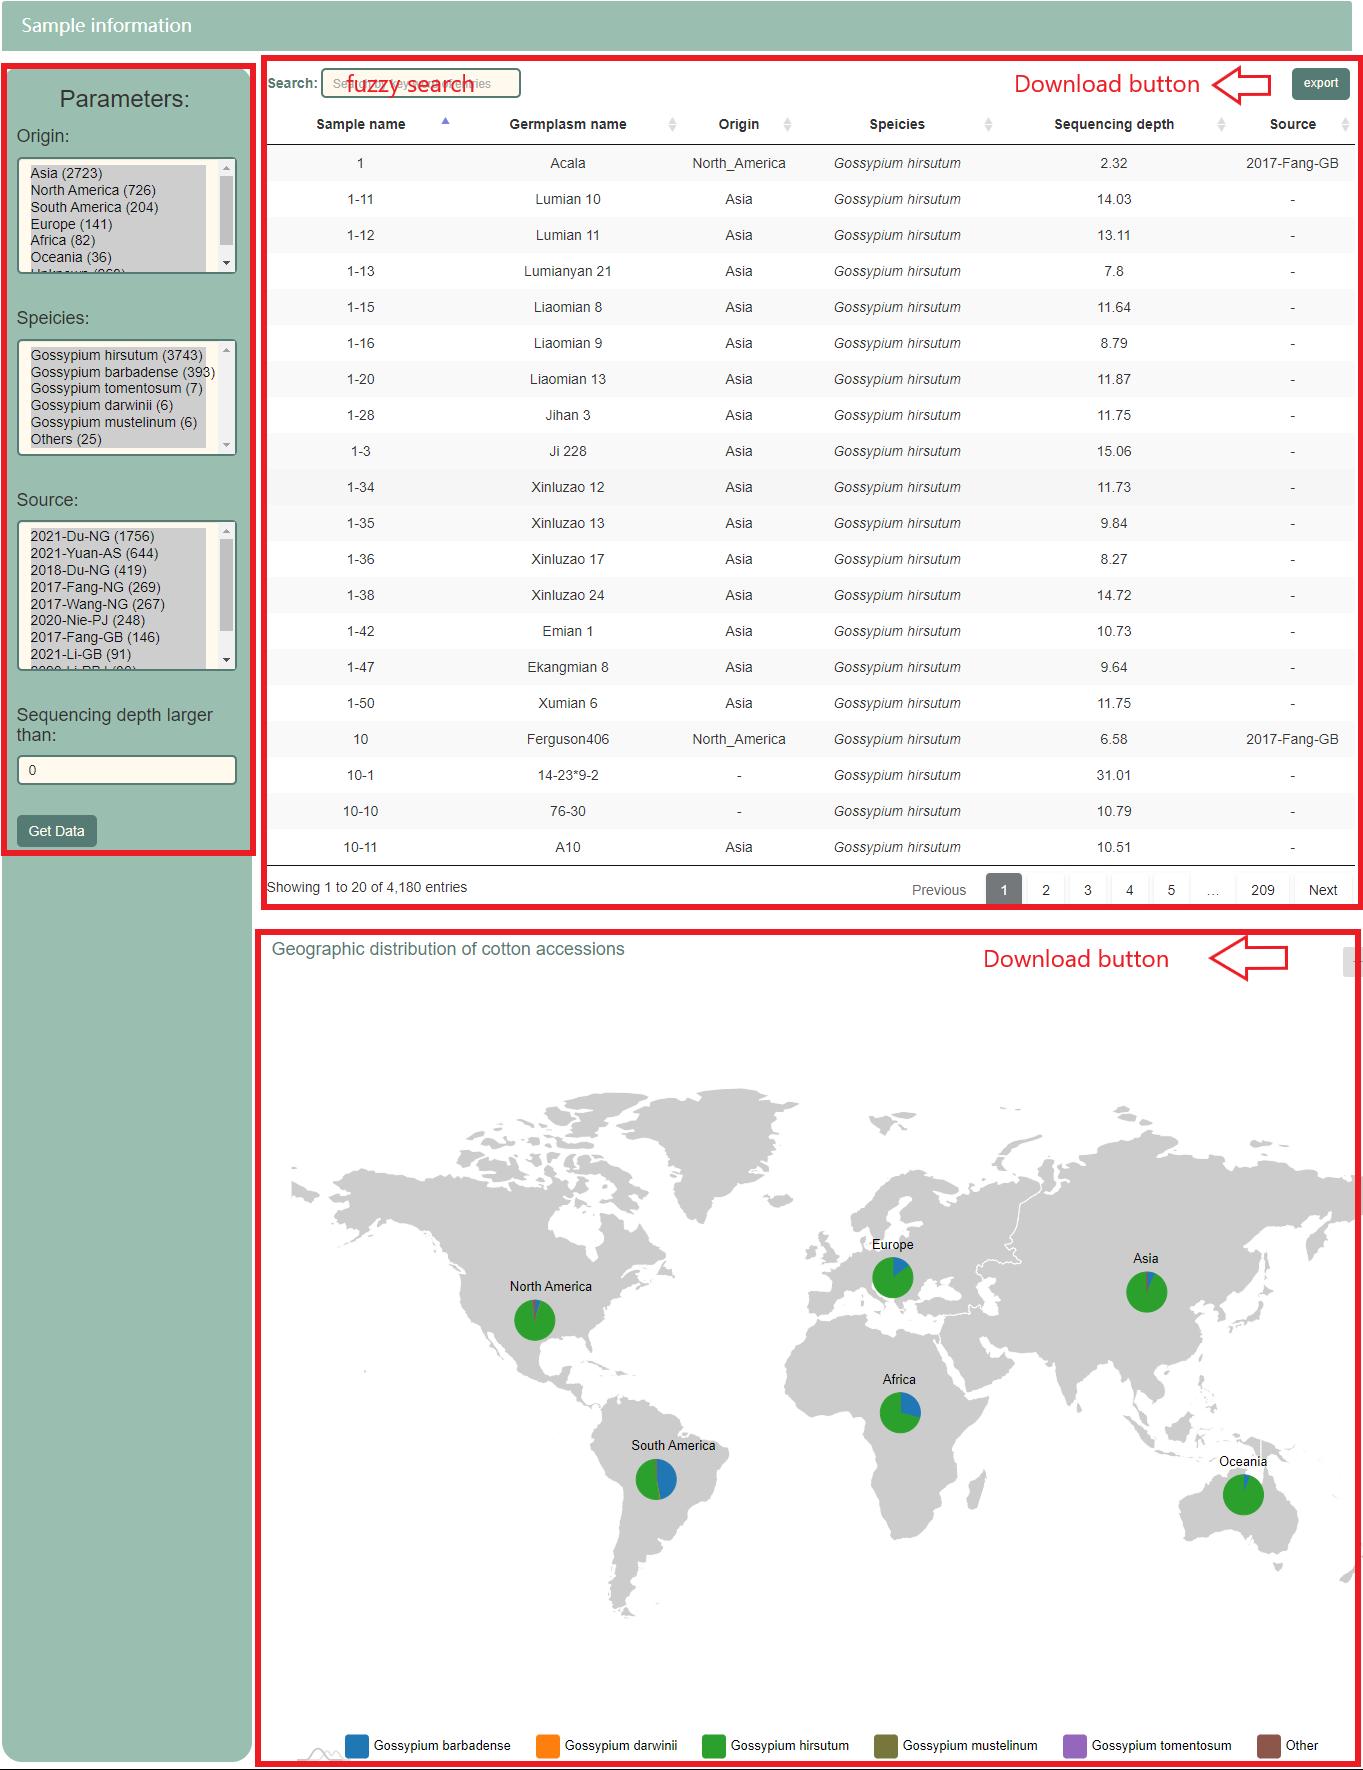
3.1 Sample information
Sample information page presents basic information of cotton accessions, compromising three parts All the figures and tables can be download by clicking the button locate in the upper right corner.
Part 1: Basic information table of cotton accessions. Fuzzy search is supported for users (users can search samples by entering any characters relevant to accessions).
Part 2: Geographic distribution of cotton accessions.
Part 3: Parameters that can be set to choose the subset of the samples, according origin, specie, source and depth of the sequencing data.
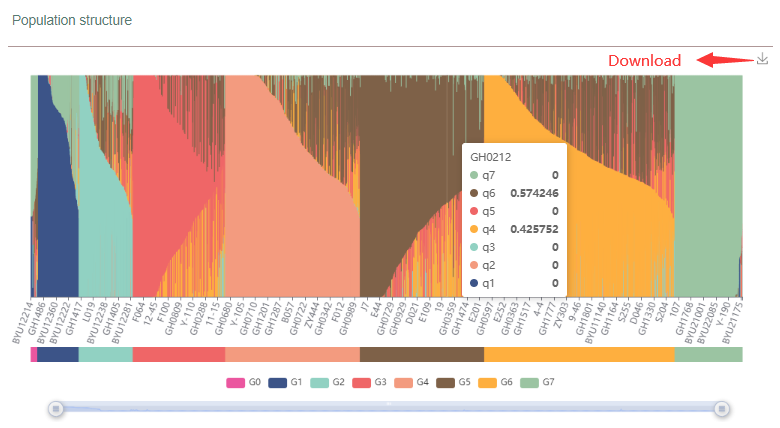
3.2 Population structure
In this database, 4,180 cotton accessions can be devided into eight groups according to SNP genotypes and their origins, named as G0-G7. G7 contains most G. barbadense accessions (n=400). G0 (n=39) consisting of wild G. hirsutum accessions from America. G1 (n=243) consisting of G. hirsutum landraces of median American. G2 (n=317) mainly consisting of G. hirsutum landraces of southern China. G3-6 comprising of the cultivated G. hirsutum accessions. Among them, most of accessions from Northwest China (NWC) and North China (NC) were grouped into G3 (n=538); G4 (n=795) contains accessions from three historical Chinese cotton planting areas; G5 (n=728) contains accessions from Yangzi River region (YZR); G6 (n=1,120) contains accessions from Yangtze River region (YZR) of China and the United States.
Part 1: Population structure of cotton accessions. When mouse over the bar, information of the accessions are shown.
Part2: PCA analysis for cotton accessions. More interactive features can be used via toolbar in the upper right corner.

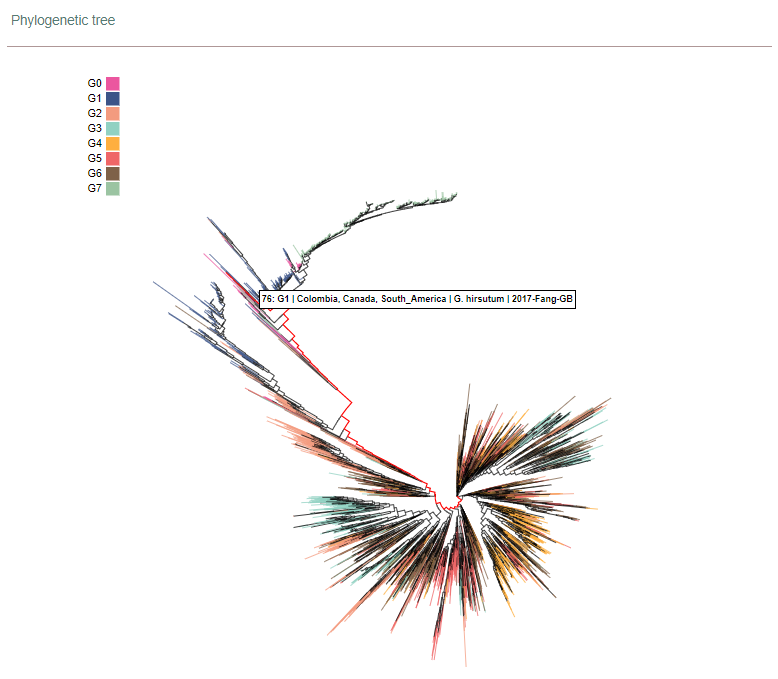
Part 3: Phylogenetic tree of cotton accessions. When mouse over the branches, information of the accessions are shown.
Part 4: Parameters that can be set to choose the subset of the samples, according origin, sub-population and source.
3.3 Selective signals
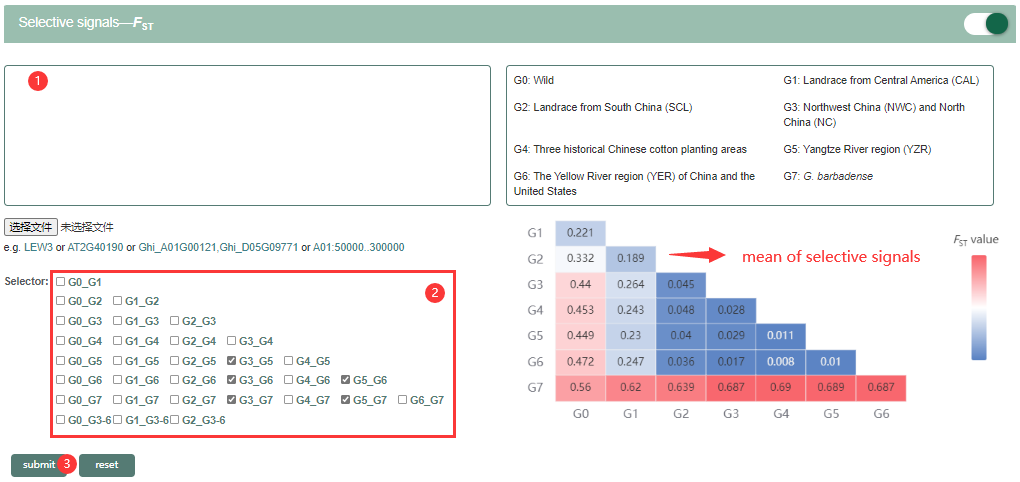
To identify genomic regions during the domestication and selection process, genetic diversity (π), Tajima's D, pairwise fixation statistic (FST) and XP–CLR values were calculated. Average pairwise fixation statistic (FST) values among subgroups demonstrated that the genetic divergence within cultivated subgroups (G3-6) was low (0.007-0.028) compared with those among cultivated accessions and G1 (0.229-0.263) and between landraces (0.189), and those among cultivated accessions and G2 were intermediate (0.036-0.047).
3.3.1 FST
3.3.1.1 Input
Steps for usage:
Step1: Enter your search value. Gene index or genomic regions are supported. Null input is also supported, it will cause genome-wide plot to be displayed.
Step2: Choose the subgroup you are interested in.
Step3: Get search results.
3.3.1.2 Result page
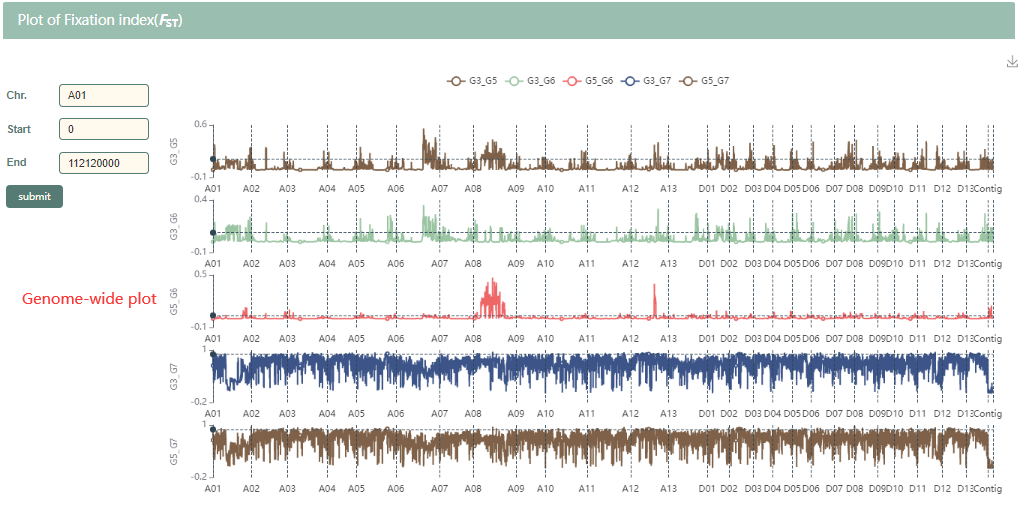
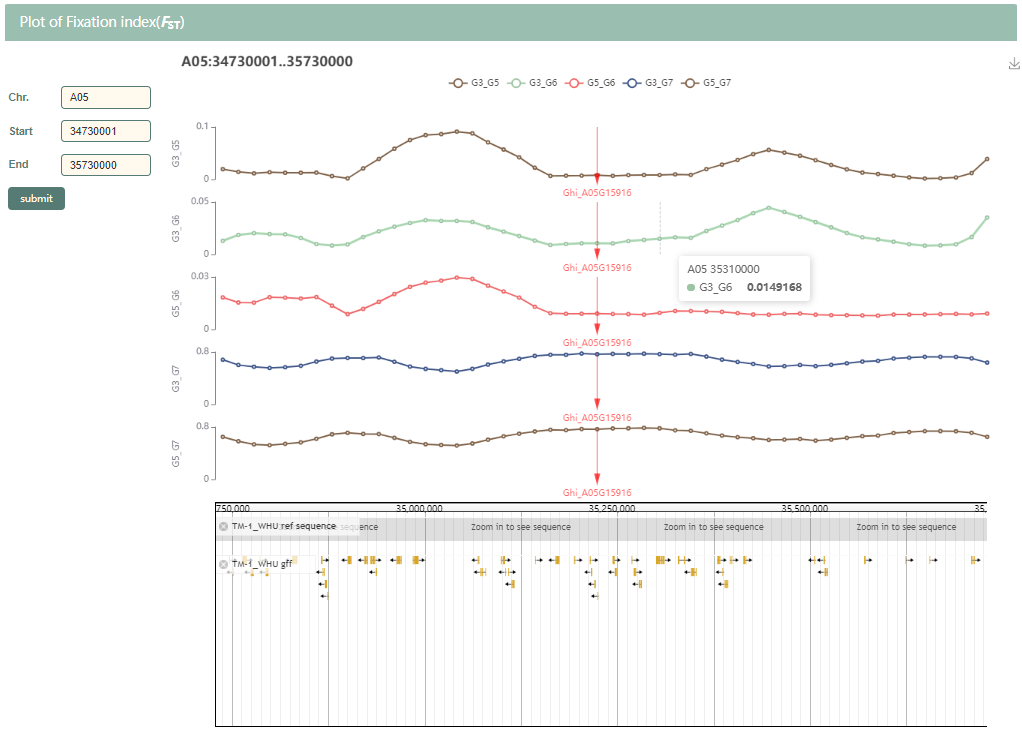
Users can zoom in and out the genome-wide plot to screen the FST value of the specific region by scrolling the mouse. In line plot of FST value at the top, subgroups of your choice are shown, respectively. Gene density, genes module and genome sequence will be shown in JBrowse at the bottom when gradually zoom out the line plot. Mouse over the line plot to view the FST value and genome position.
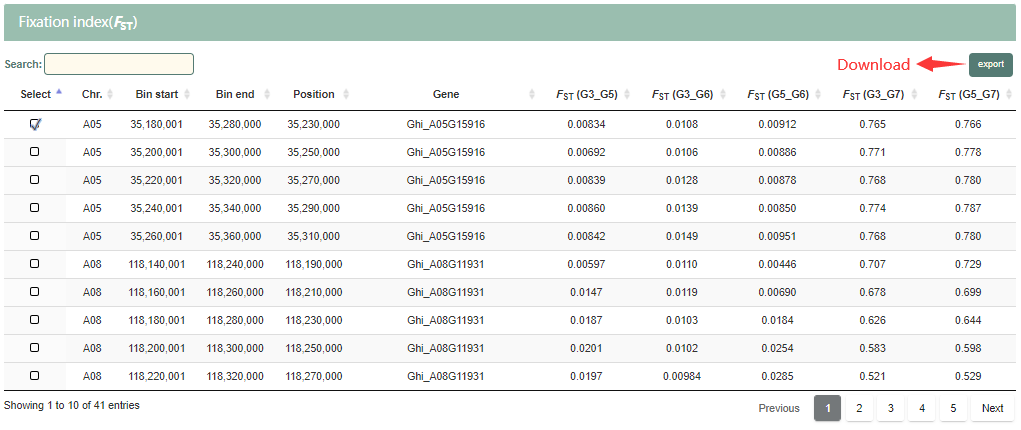
Users can also screen the FST value of the specific region by entering genomic region or gene index. "AT2G40190" is entered here. In the result page, table with FST value, line plot and JBrowse of target region are available for download or browse.
3.3.2 π, Tajima's D and XP-CLR
Input and the result pages of π, Tajima's D and XP-CLR is similar to that of FST
4 Variation module
Variation module integrates genetic variations, phenotype, and transcription data of the cotton population, providing variation query and association between genotype and phenotype in mining candidate variations/genes traits. There are two functional interfaces in Variation module, including Single-locus model and Multiple-locus model. Information about variations, including annotation, allele frequency, distribution, description of gene expression and phenotypic values, are provide in Single-locus model, enabling user to screen candidate variations/genes of traits. Multi-locus model enables users to combine the multiple loci cross genes to check gene-gene interactions and their contribution to phenotype.
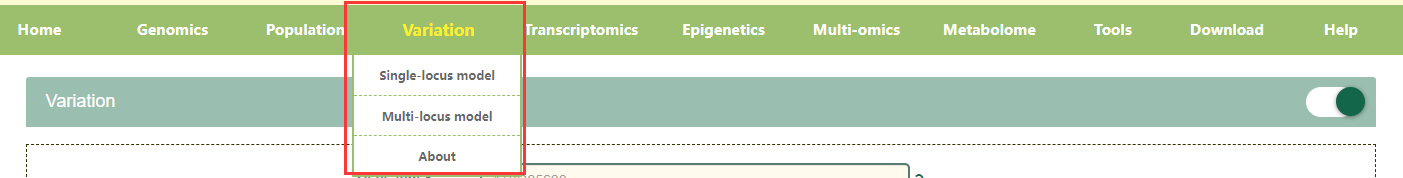
4.1 Single-locus model
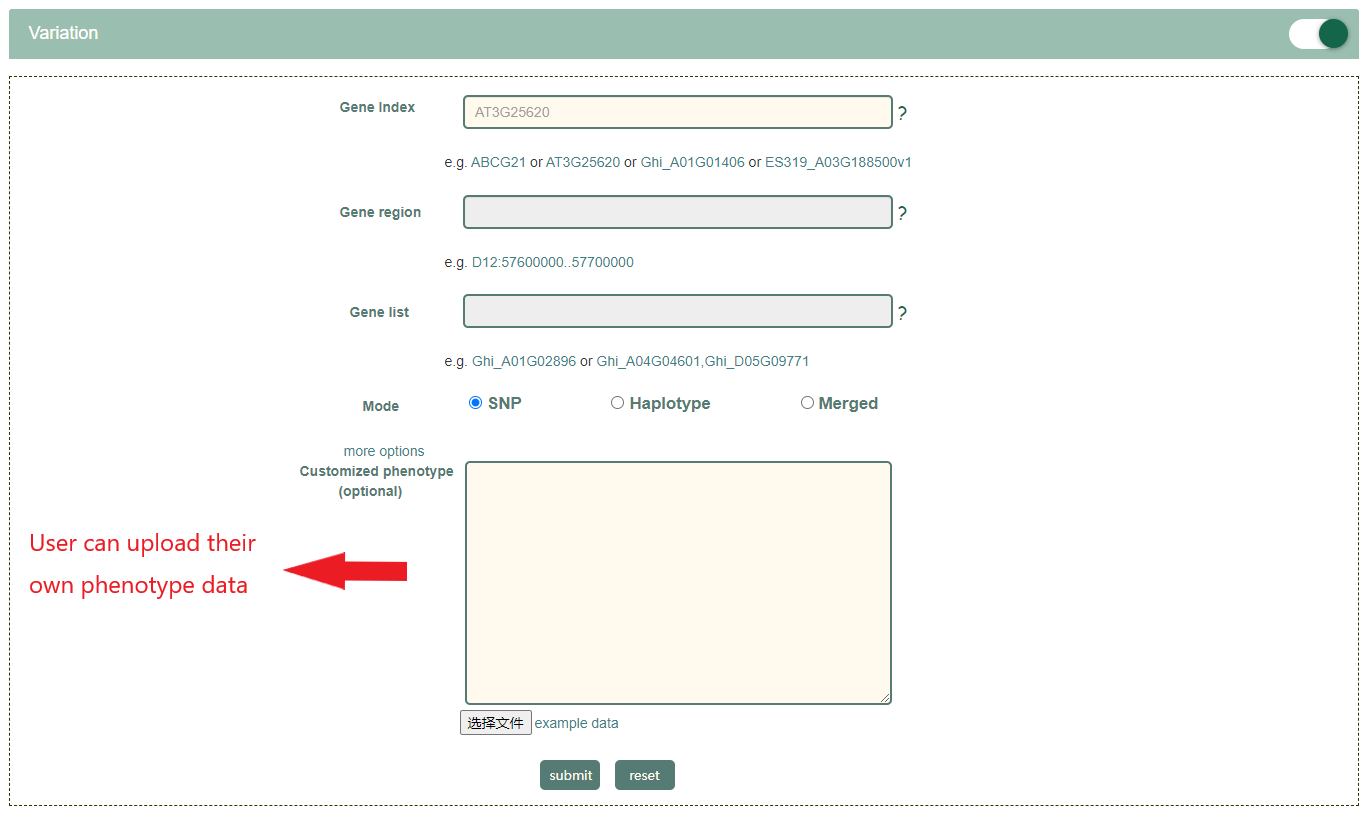
4.1.1 Input
Gene index: gene name and gene ID of 25 published cotton and Arabidopsis genomes, users can view specific information about the 25 cotton genomes in the about page.
Genomic region: genomic region of TM-1_WHU genome in a format of "chr:start..end".
Gene list: gene ID of TM-1_WHU reference.
Mode: Users can choose SNP, Haplotype or both types of variations.
4.1.2 Result page of SNP mode
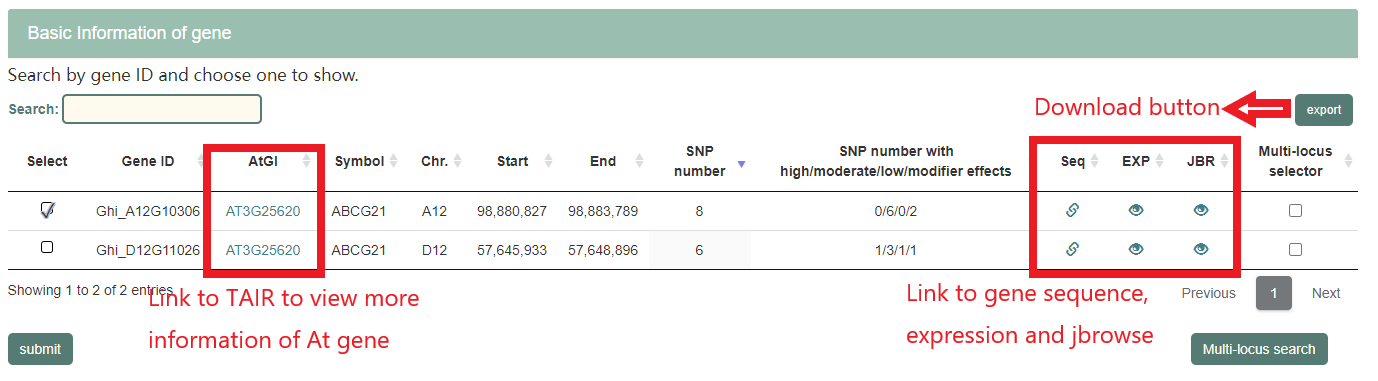
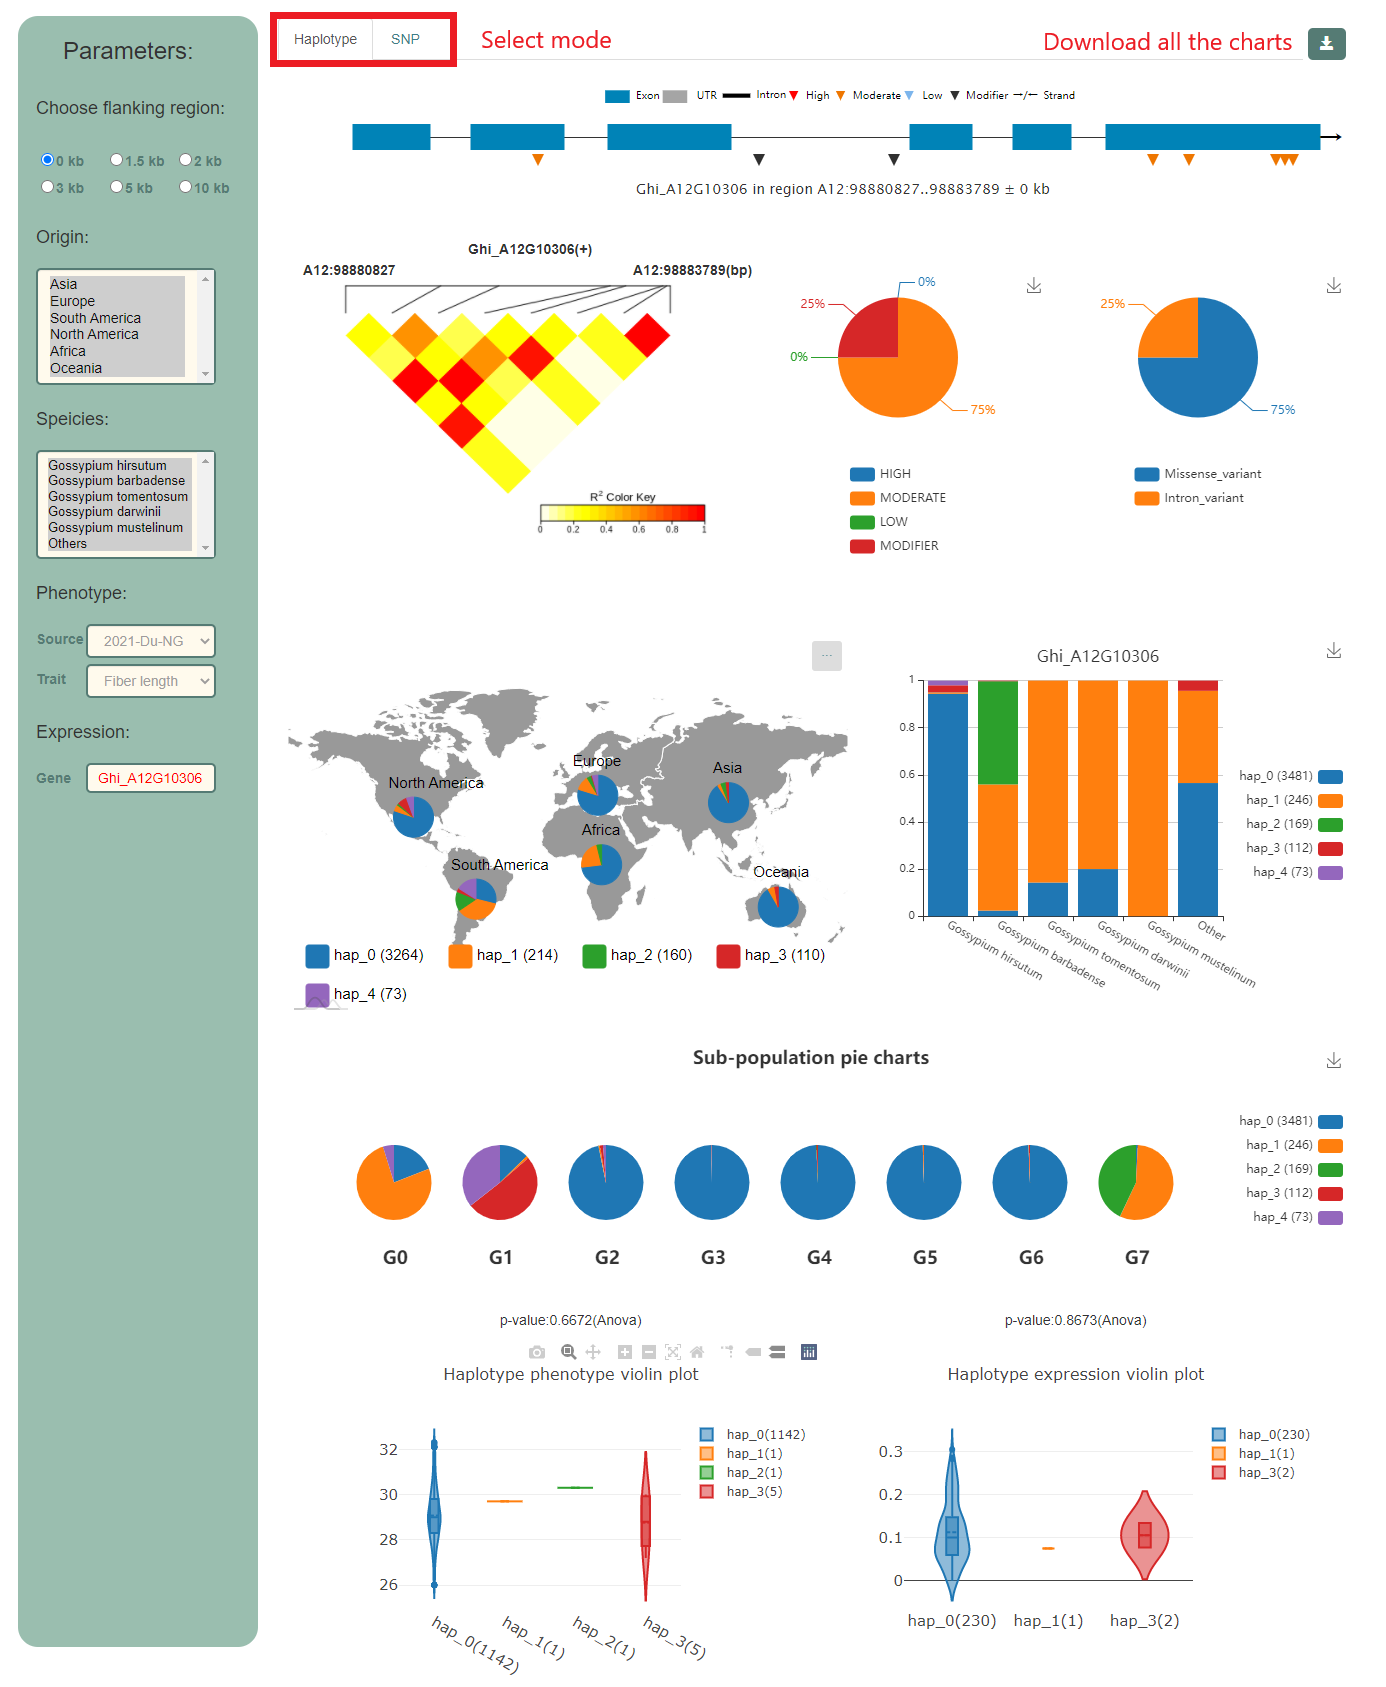
We demonstrate the search results with the AT3G25620 gene. After entering "AT3G25620" and choose "SNP" mode in search bar, the result page will shown in minute. The result page compromise 11 parts. Figures and tables in the result page are interactive and downloadable by click the button locate in the upper right hand corner.
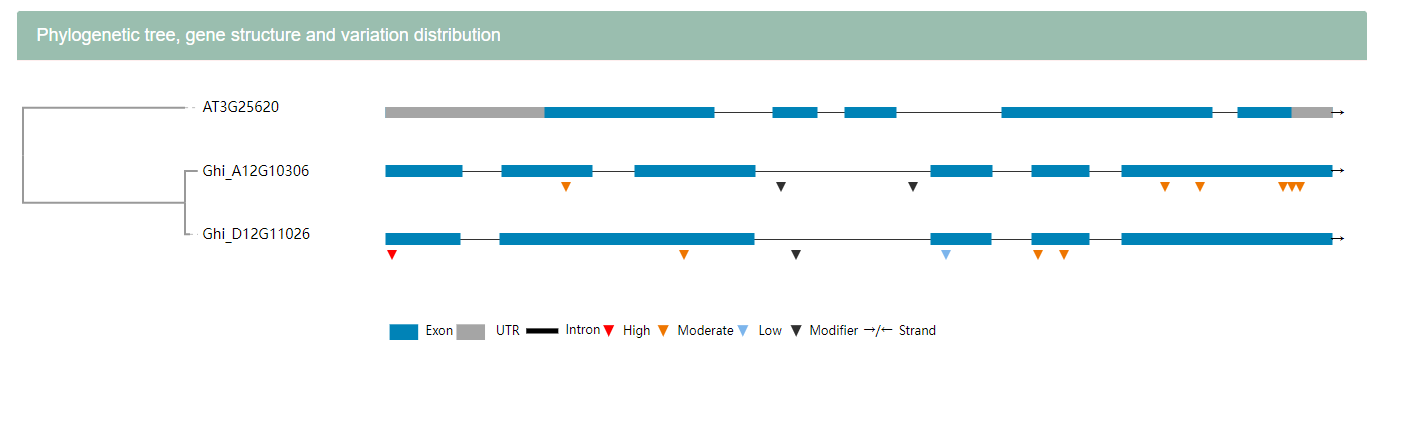
Part 1: Table of target genes and their basic information. Orthologs of AT3G25620 in TM-1_WHU are shown in the table. Uses can click the blue column to get more information about the genes. User can choose one gene for further analysis. Ghi_A12G10306 is selected here.
Part 2: Phylogenetic tree of orthologs genes of cotton and Arabidopsis. For each gene in tree, the gene structure is shown with SNPs or short InDels at the bottom indicated by colored triangle. Mouse over to see brief information of the variation.
Part 3: Define the upstream and downstream of the target gene. "0 kb" is selected by default.

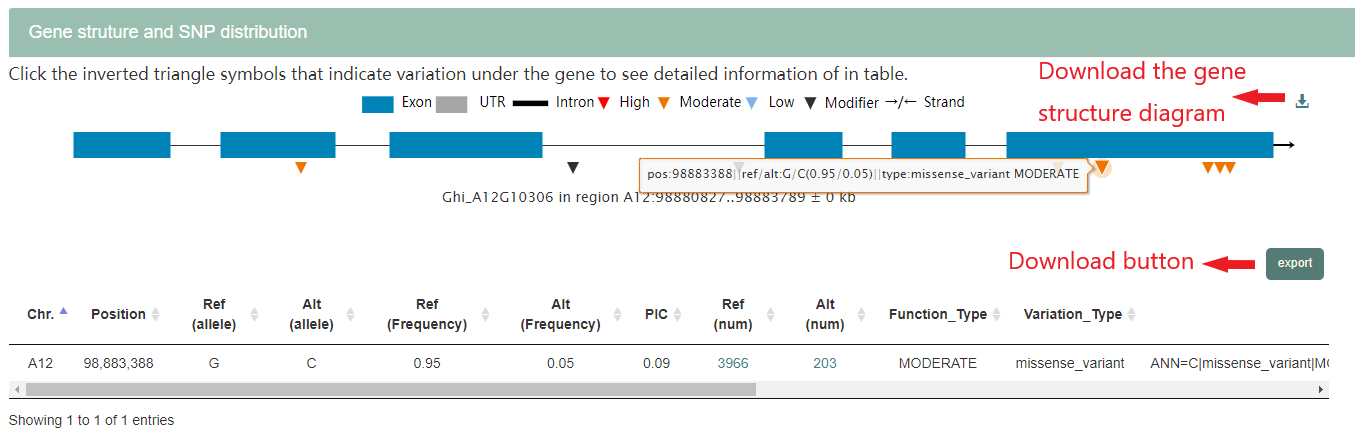
Part 4: Gene structure and distribution of the variations. Variations are represented by triangles with different colors. Mouse over to see brief information of the variation. Click the triangle to see annotation of variation in the table at bottom.
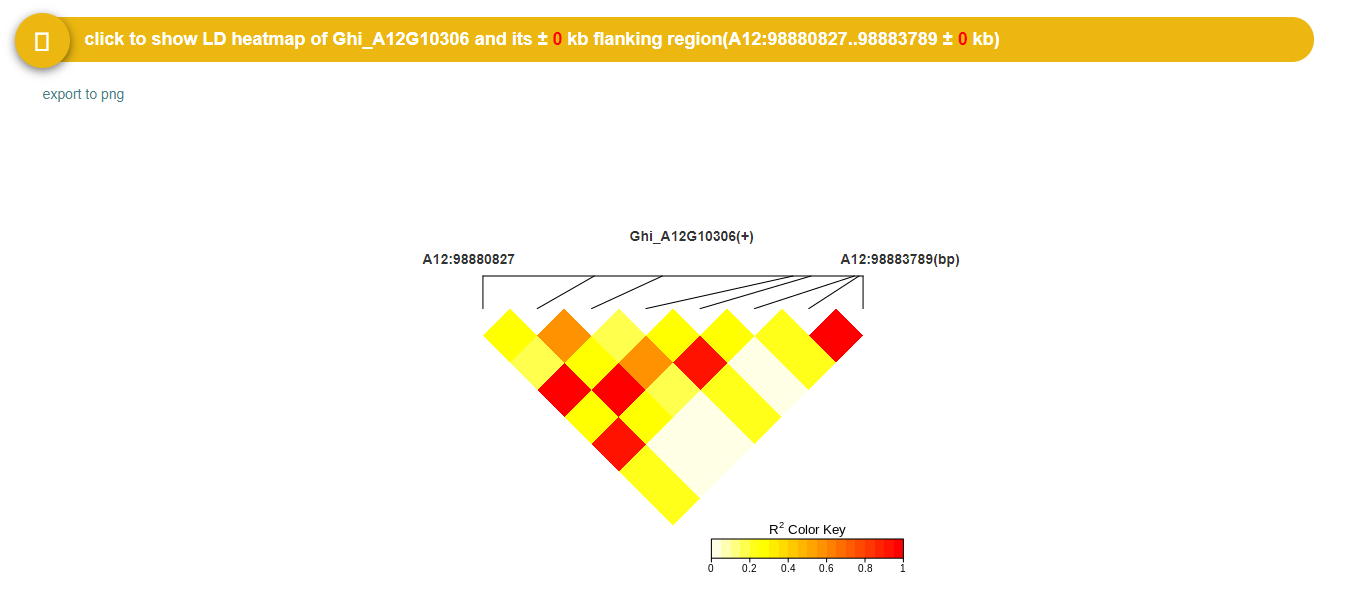
Part 5: LD heatmap of the gene.
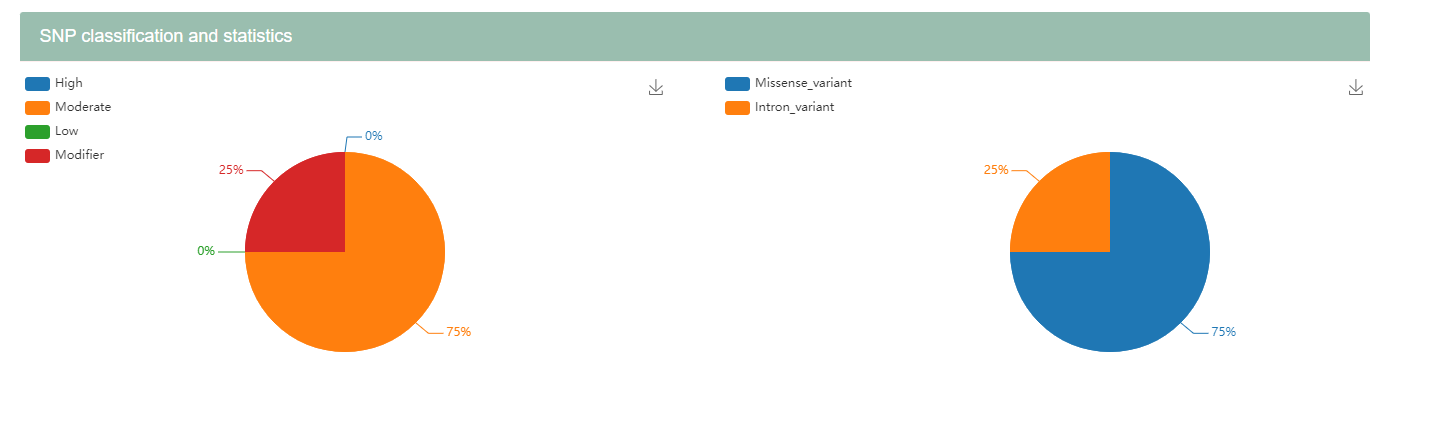
Part 6: Statistics of the annotation result of variations.
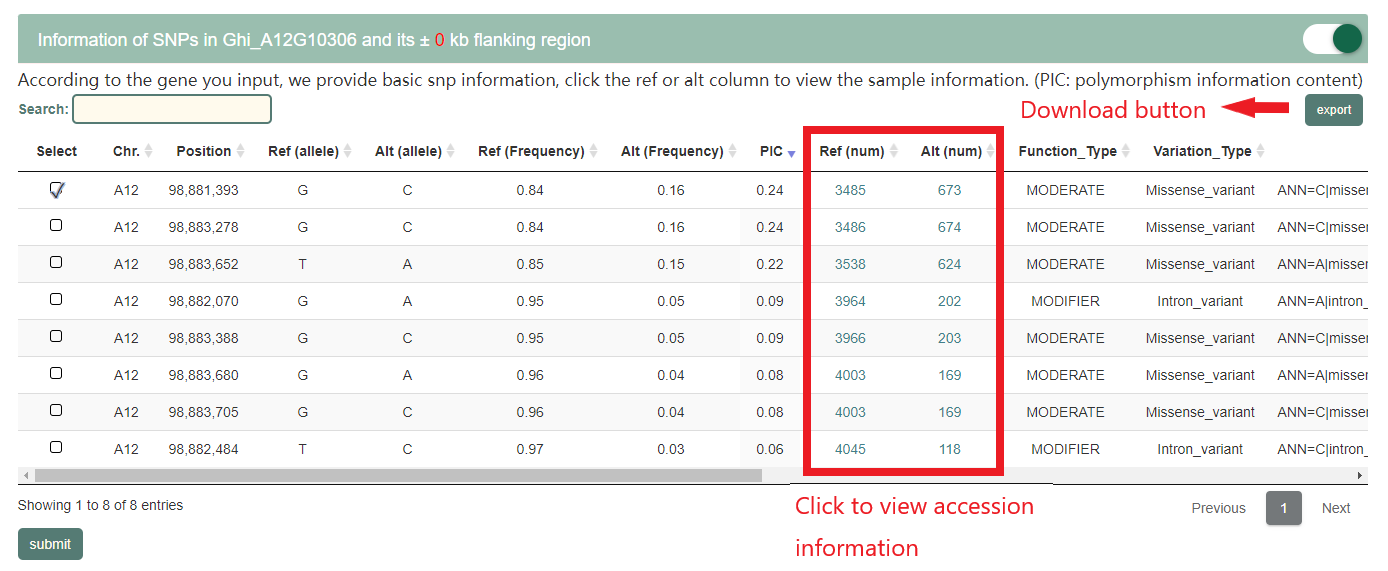
Part 7: Table showing the detail information of the variations. Users can search variations by entering any characters relevant to variation. Click number of "Alt" and "Ref" column will view the table of sample information.
Part 8: Allele frequency of the selected variation. Bar plot shows the allele frequency for each species, while the pie graph shows the different subpopulations. Users can choose species and change style of the figure by setting the parameter in the left.

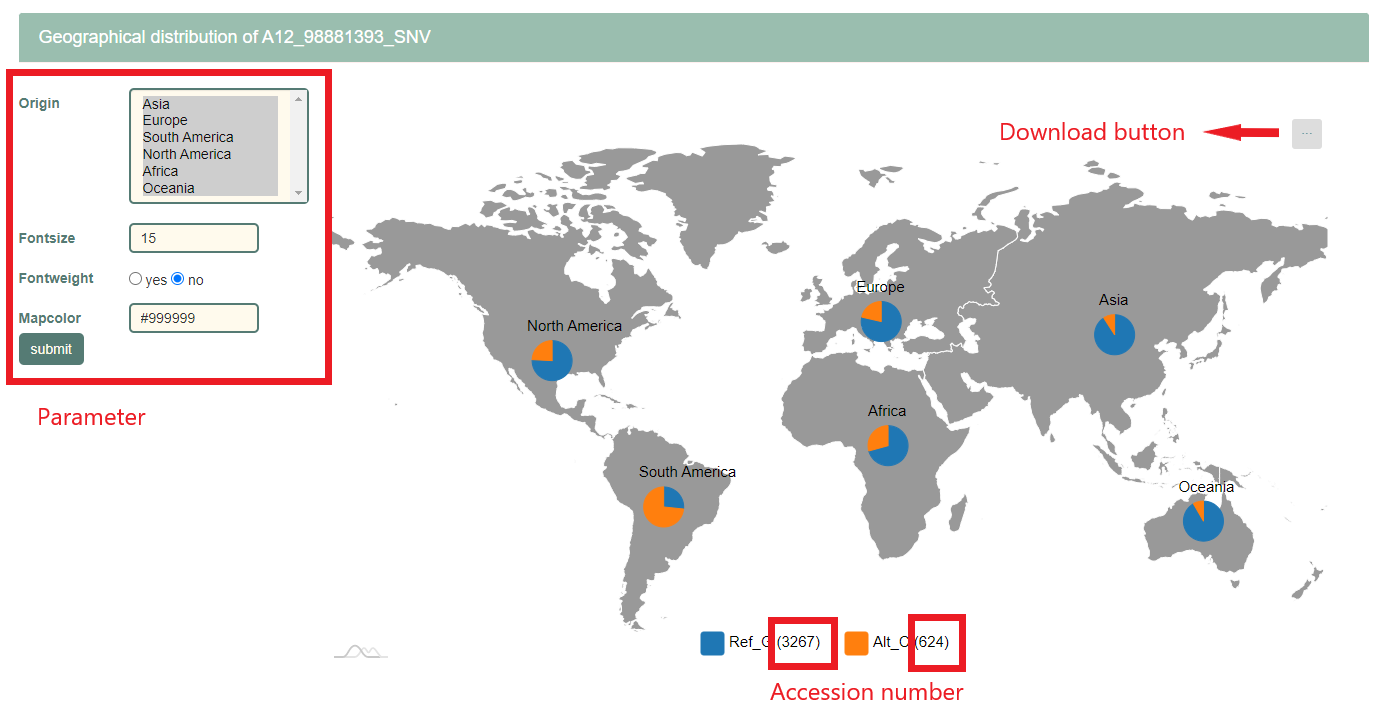
Part 9: Geographic distribution of the accessions with different alleles. Users can choose origin and change style of the figure by setting the parameter in the left.
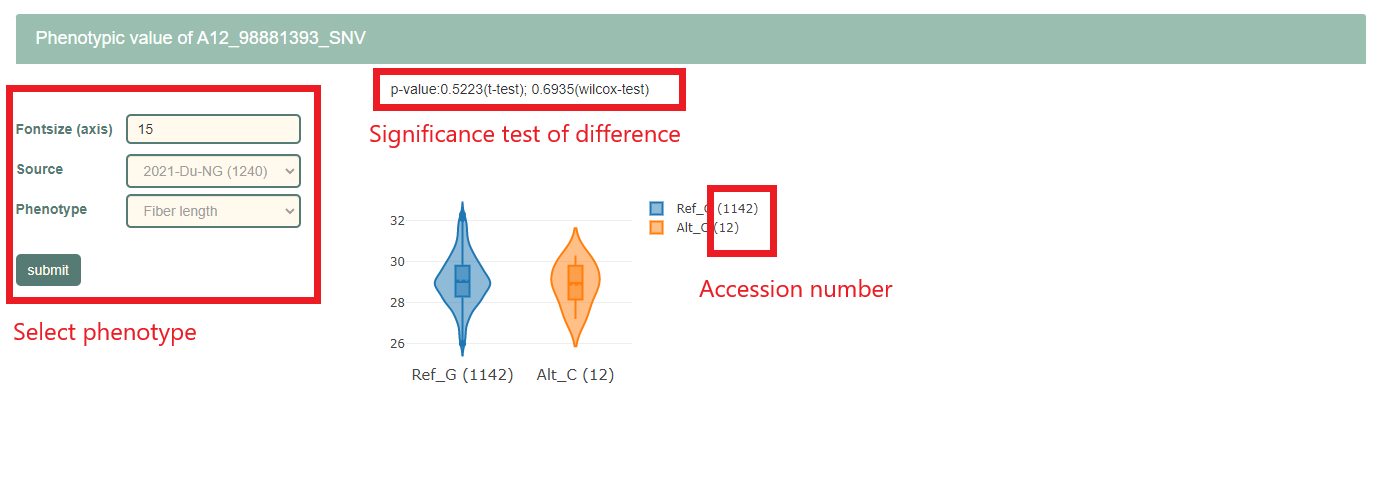
Part 10: Phenotypic effect of the selected variation. Violin plot shows the distribution of phenotype value of the cotton accessions with different alleles. Number of accessions of "Alt" and "Ref" are shown in legend. Differenced determined by Student's t-test and Wilcoxon test are shown at the top. 23 traits are provided to be choose in left hand.
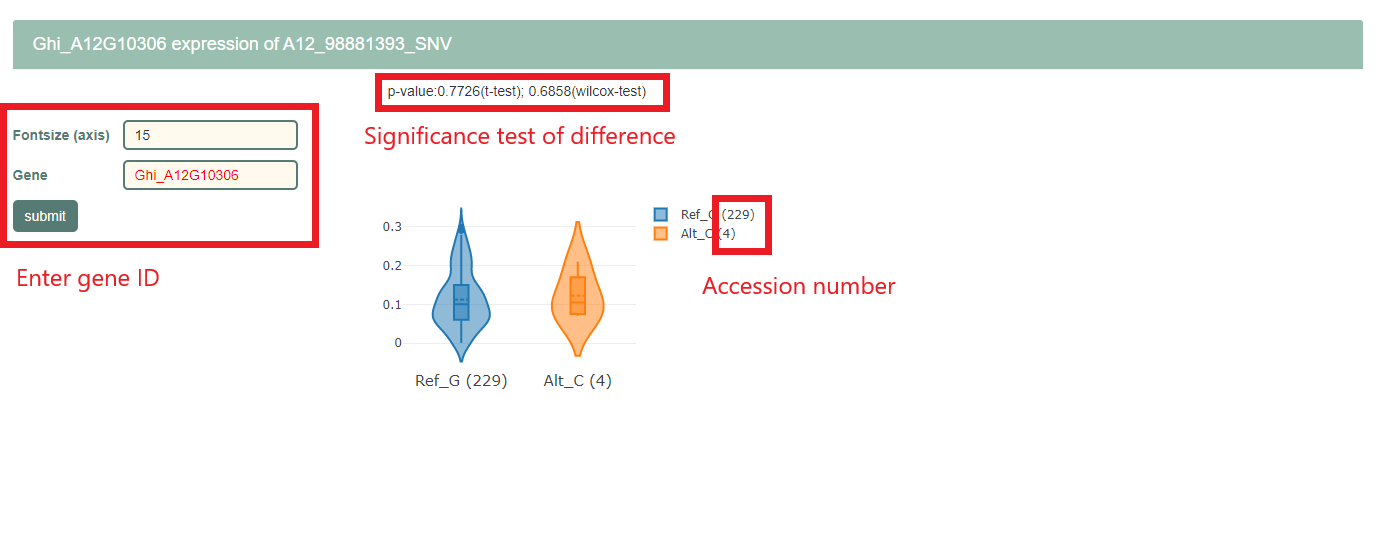
Part 11: Gene expression of cotton accessions with different alleles. Violin plot shows the distribution of gene expression level of the cotton accessions with different alleles. Number of accessions of "Alt" and "Ref" are shown in legend. Differenced determined by Student's t-test and Wilcoxon test are shown at the top. Users can enter TM-1_WHU gene ID in left hand.
4.1.3 result page of the Haplotype
The result of Haplotype mode is similar to that of SNP mode.
4.1.4 Result page of the merge mode
All the figures and table are arranged compactly. All the parameters are in the left hand. Users can quickly switch the result page of SNP and haplotype by click them at the top.
4.2 Multi-locus model
This page enables users to combine the multiple loci cross genes to check gene-gene interactions and their phenotypic effect.
4.2.1 Input
Users can enter gene index, or genomic regions (separated by comma). Gene number should be not more than 70.
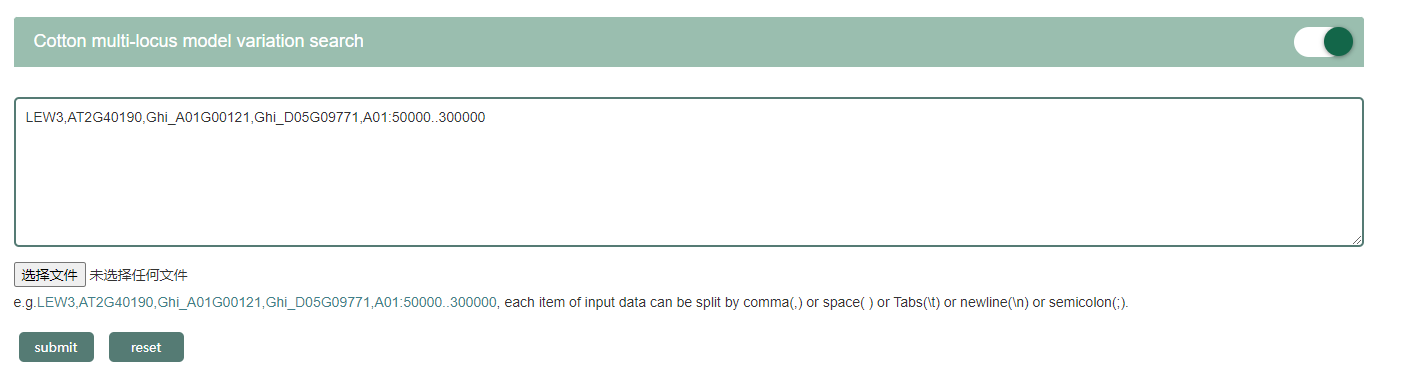
4.2.2 Result page
The result page including four parts. We show the result of the input of "LEW3, AT2G40190, Ghi_A01G00121, Ghi_D05G09771, A01:50000..300000" here.
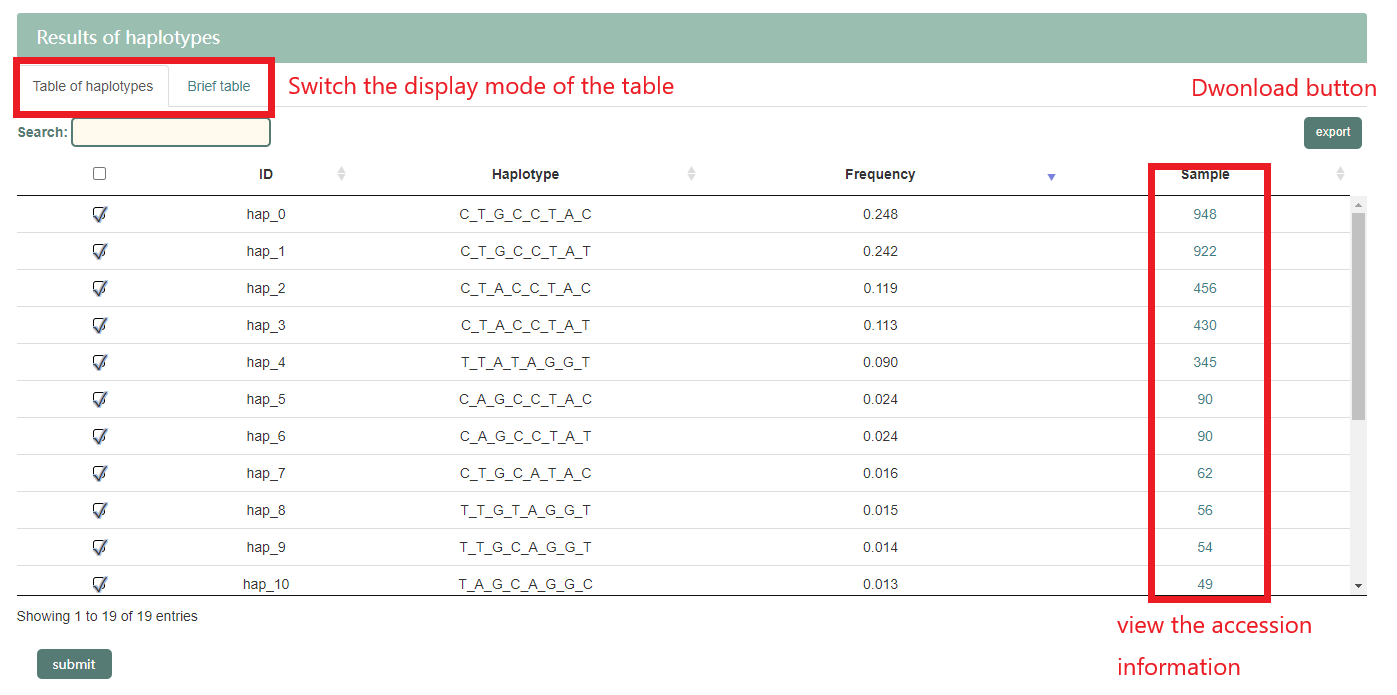
Part 1: Variation information of each input. Information of the variation table is described above. Click tabs at the top of the result page and select interested variations for each genes and then submit. Four variations are selected here.

Part 2: Detail information of the selected variation combinations, including allelic combination and their accession number, frequency. Click tabs at the top of the result page will switch between the haplotype information table and the brief table. Click the number of the accession will view the table with accession information.

Part 3: Phenotypic effect of the locus combinations. Violin plot shows the distribution of phenotype value of the cotton accessions with different combinations. Number of accessions of each combination is shown in legend. 23 traits are provided to choose in left hand.
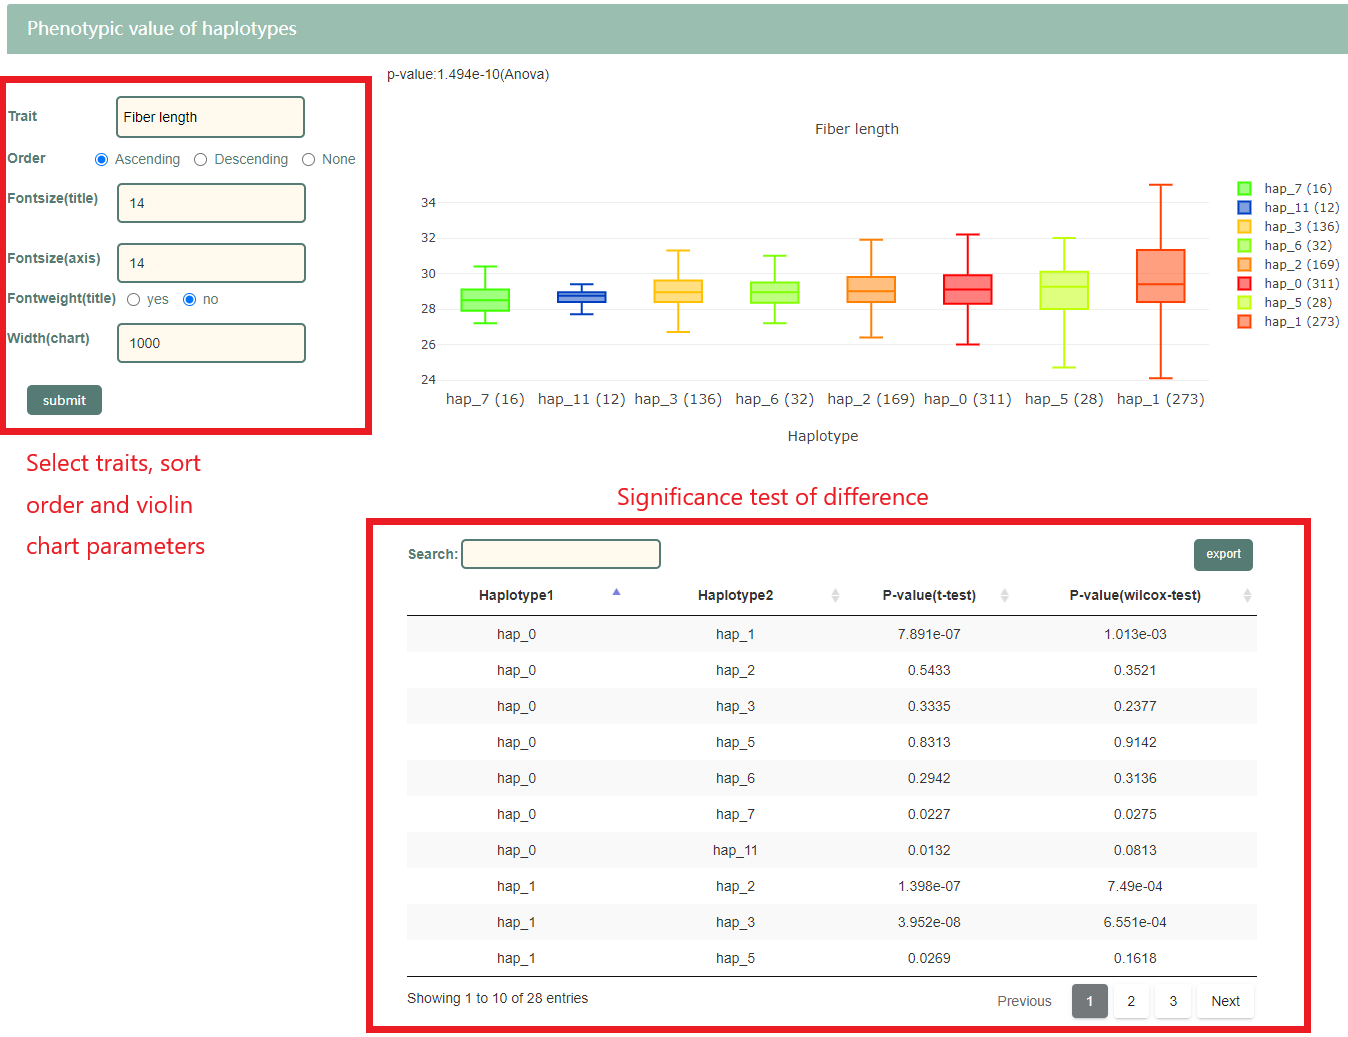
Part 4: Gene expression of cotton accessions with different combinations. Violin plot shows the distribution of gene expression level of the cotton accessions with different combinations. Number of each combination is shown in legend. Users can enter gene ID in left hand.

5 Transcriptomics module
5.1 Gene expression profile
CottonMD shows the gene expression data of Hai7124 (G. barbadense) and TM-1 (G. hirsutum) in different tissues and populations or under different treatment conditions. The tissues mainly come from root, stem, leaf, and various tissues in flowers. Environmental stresses mainly include low temperature stress, high temperature stress, drought stress and salt stress.
5.1.1 Input
Gene index: gene name and gene ID of 25 published cotton and Arabidopsis genomes, users can view specific information about the 25 cotton genomes in the about page.
Genomic region: genomic region of TM-1_WHU genome in a format of "chr:start..end".
Gene list: gene ID of TM-1_WHU reference.
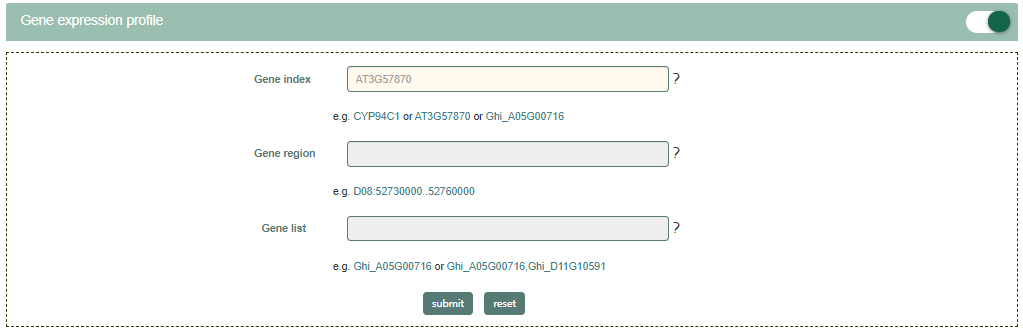
We demonstrate the search results with the AT3G57870 gene. After entering "AT3G57870" in search bar, the result page will shown in minute. The result page compromise 6 parts. Tables in the result page are downloadable by click the button locate in the upper right hand corner.
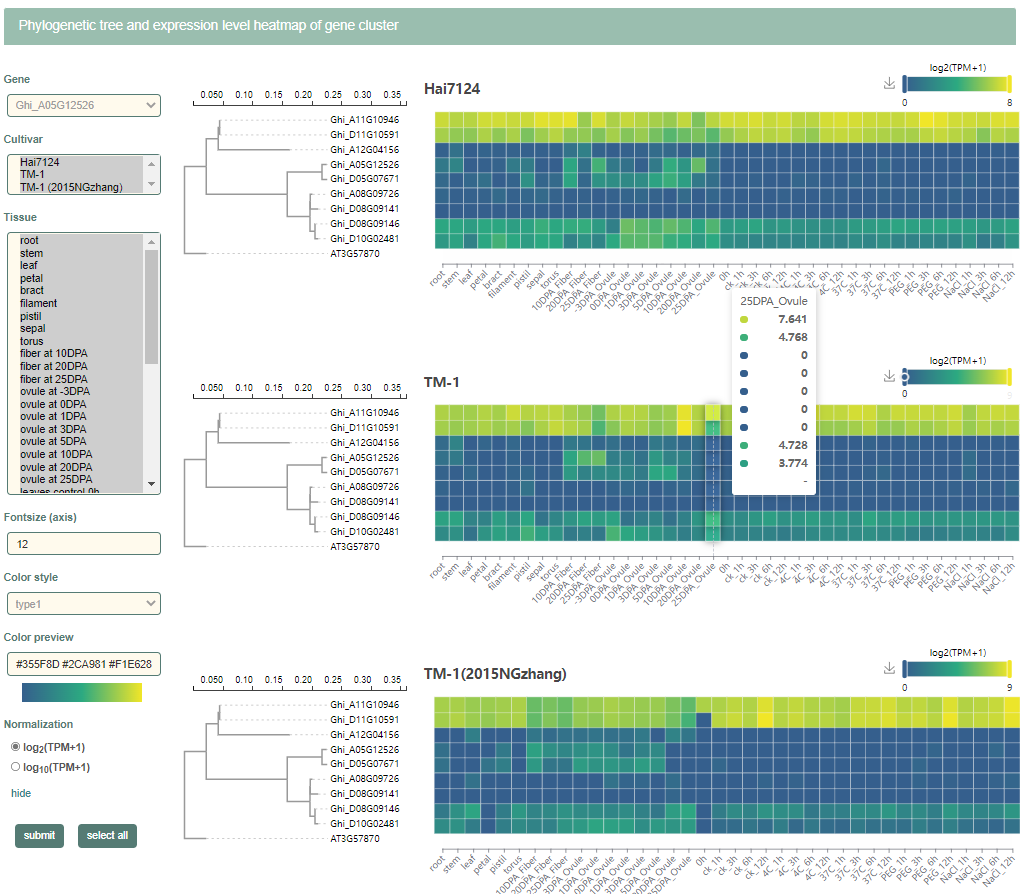
Part1: The expression level and phylogenetic tree of orthologs genes of TM-1_WHU and Arabidopsis. User can select Gene, cultivar, tissue, font size, color and normalization method in the form on the left.
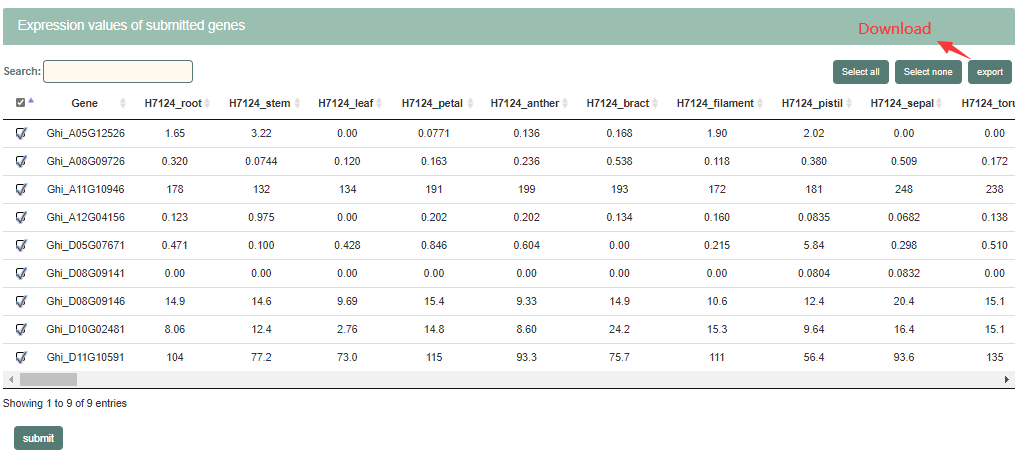
Part2: Expression values of submitted genes. User can choose one or more genes for further analysis.
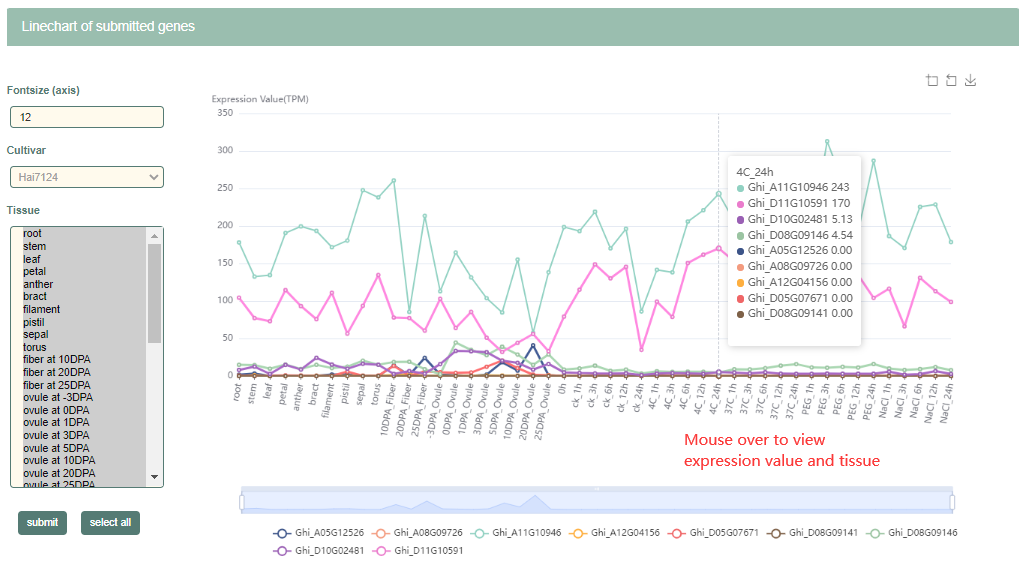
Part3: Line graph of gene expression level submitted in the part2.
Part4: Comparison between Hai7124 and TM-1 cultivar. Users can intuitively observe the difference between the expression levels of the two cultivars through this part.
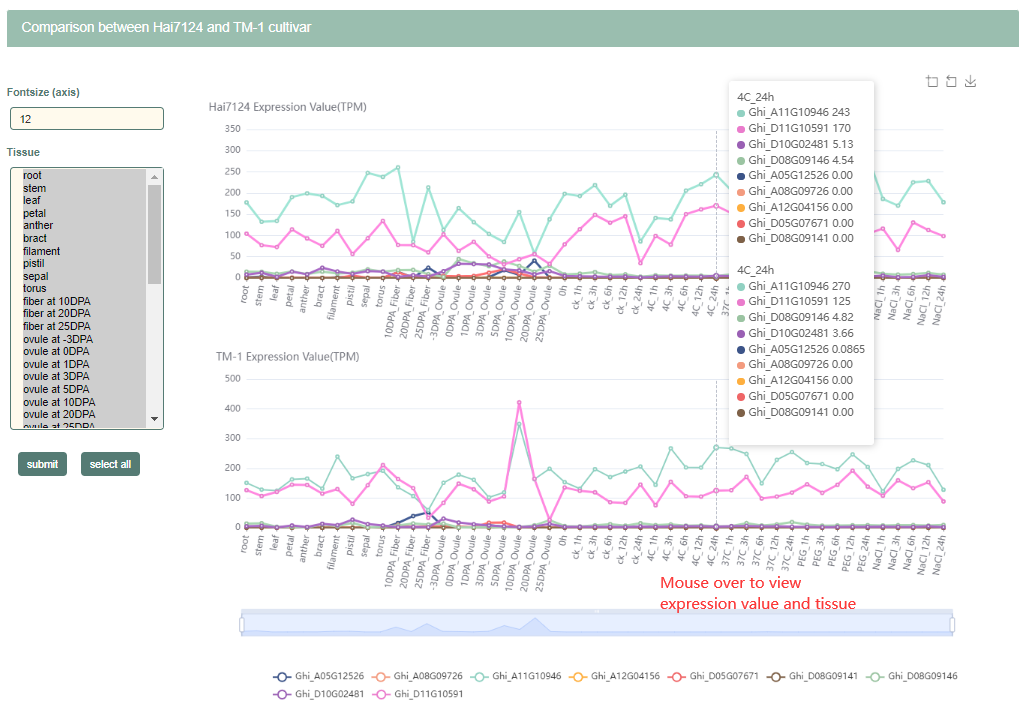
Part5: Comparison of gene expression under stress environment. This part shows the difference in gene expression under cold, heat, drought and salt stress.

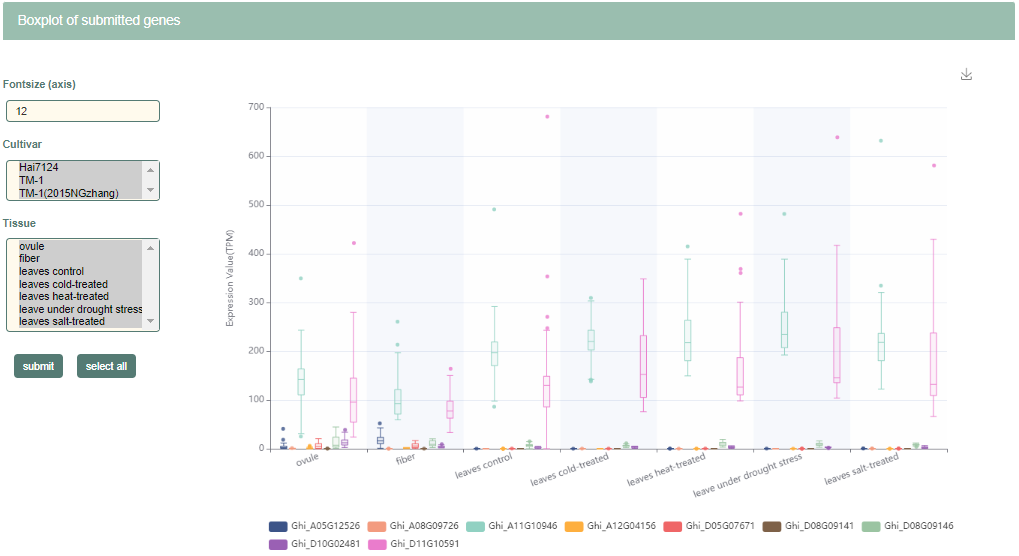
Part6: Boxplot of submitted genes. In this part, users can browse box plots of gene expression in various tissues.
5.2 Co-expression
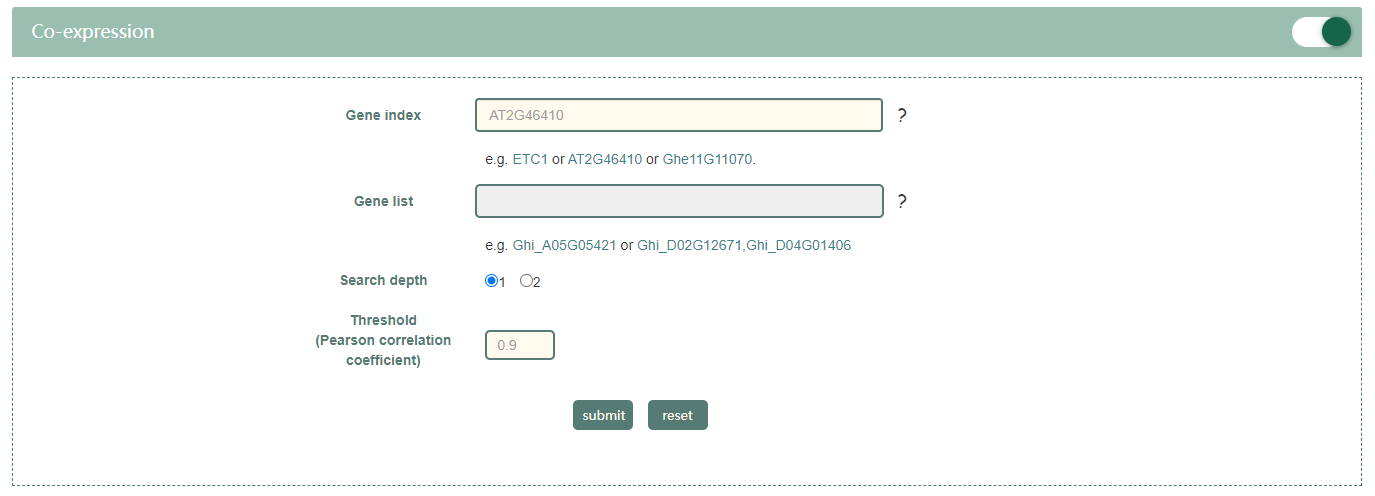
5.2.1 Input
Gene index: gene ID of 25 published cotton genomes.
Gene list: gene ID of TM-1_WHU reference.
Search depth: The depth of the gene-gene network graph in the search results.
Threshold: Set the minimum value of the Pearson correlation coefficient of the search result gene pair.
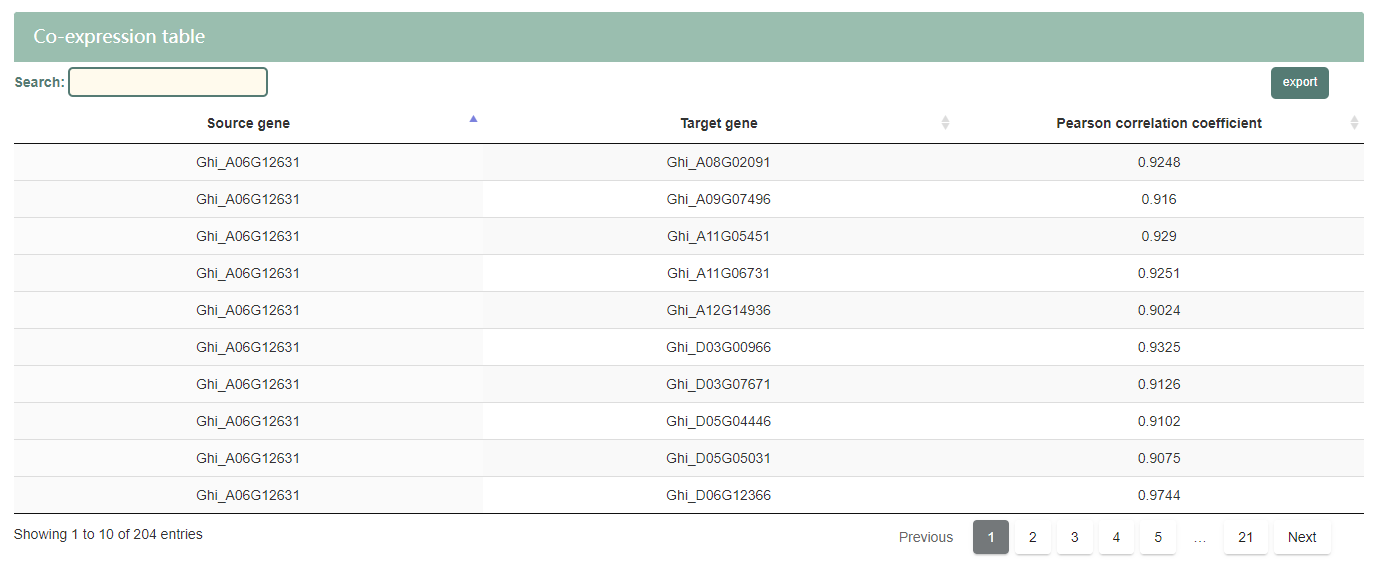
5.2.2 Result page
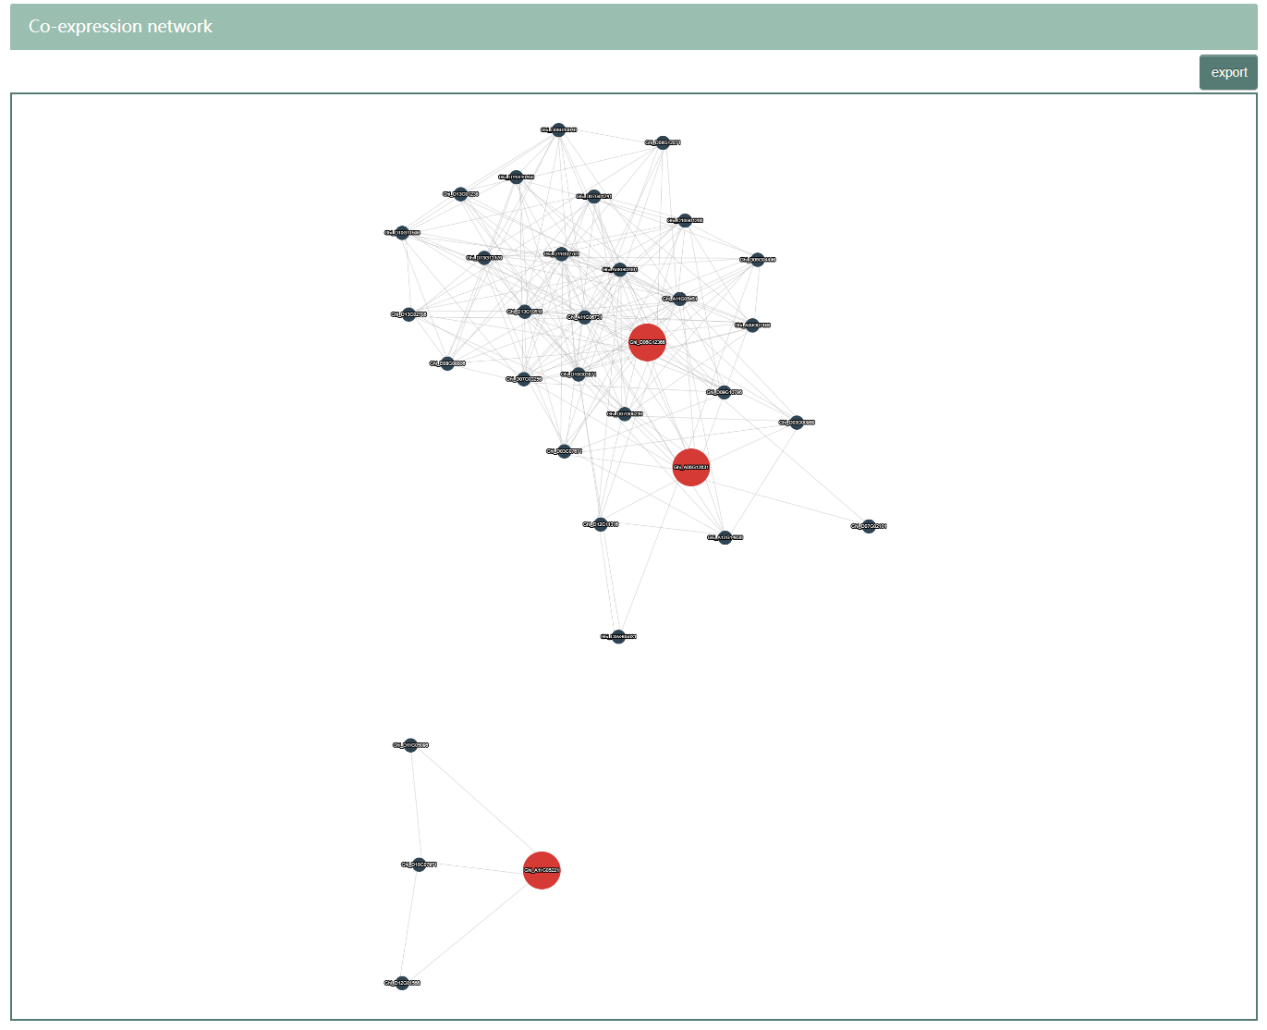
We demonstrate the search results with the AT2G46410 gene. After entering "AT2G46410" in search bar, the result page will shown in minute. The result page compromise 2 parts. Figures and tables in the result page are interactive and downloadable by click the button locate in the upper right hand corner.
Part 1: Gene co-expression network diagram. The red mark in the figure is the gene searched by users, and the gray is the gene associated with it.
Part 2: Table of gene co-expression information. Pearson correlation coefficient of gene-gene pair are shown in the table.
5.3 Gene expression in population
5.3.1 Input
Gene index: gene ID of 25 published cotton genomes.
Gene list: gene ID of TM-1_WHU reference.
Samples: Select samples in the population.
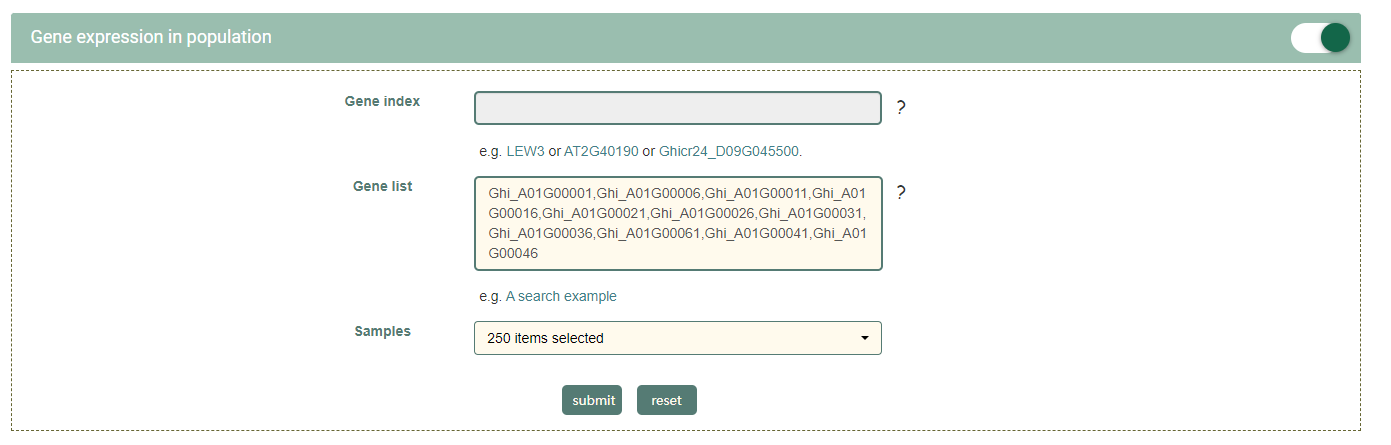
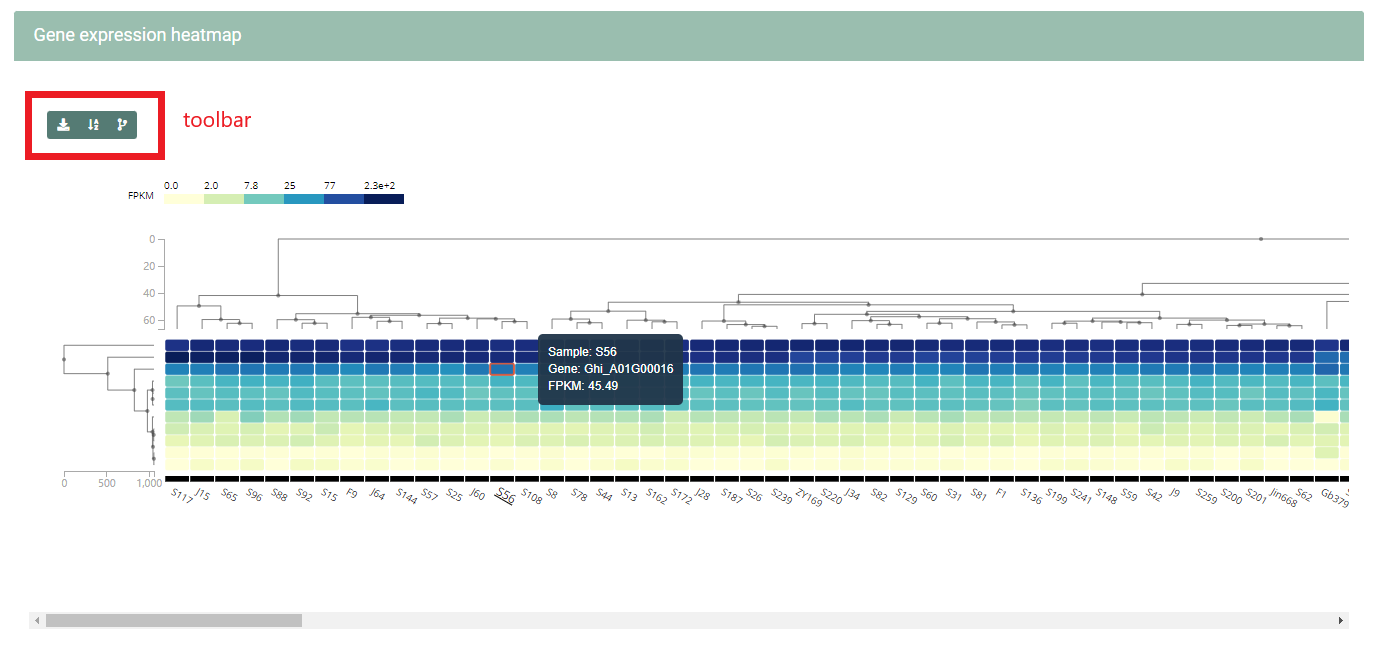
5.3.2 Result page
Click "A search example" under "gene list", and then click submit, the cluster heatmap of population expression will shown in minute. Download and more interactive features are shown in toolbar.
6. Epigenetics module
6.1 Chromatin interaction
6.1.1 Input
Gene index: gene ID of 25 published cotton genomes.
Genomic region: genomic region of TM-1_WHU genome in a format of "chr:start..end".
Gene list: gene ID of TM-1_WHU reference.
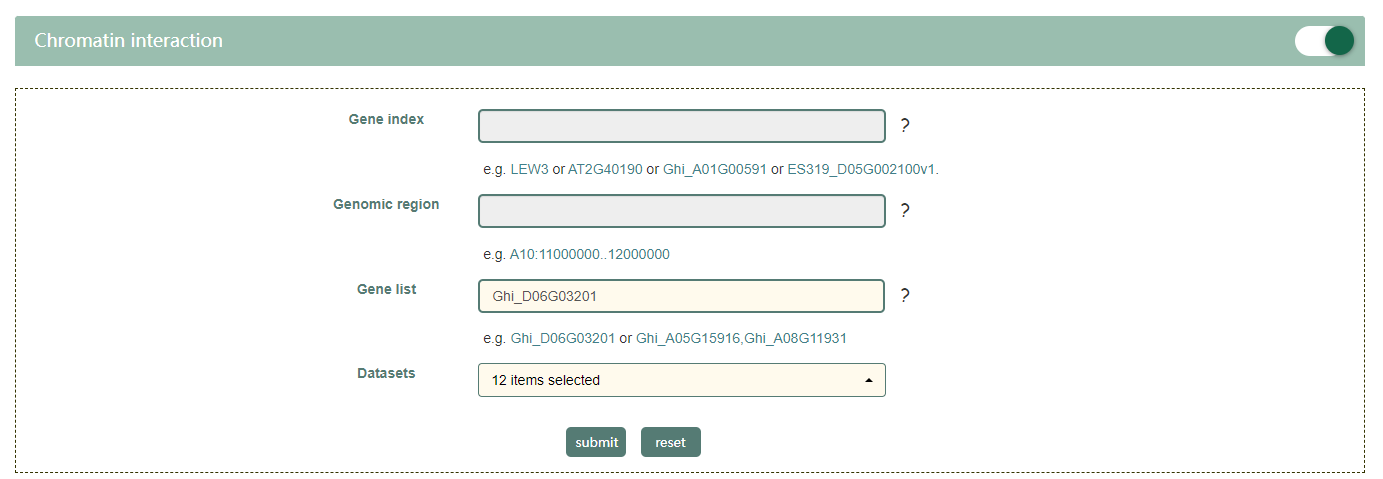
6.1.2 Result page
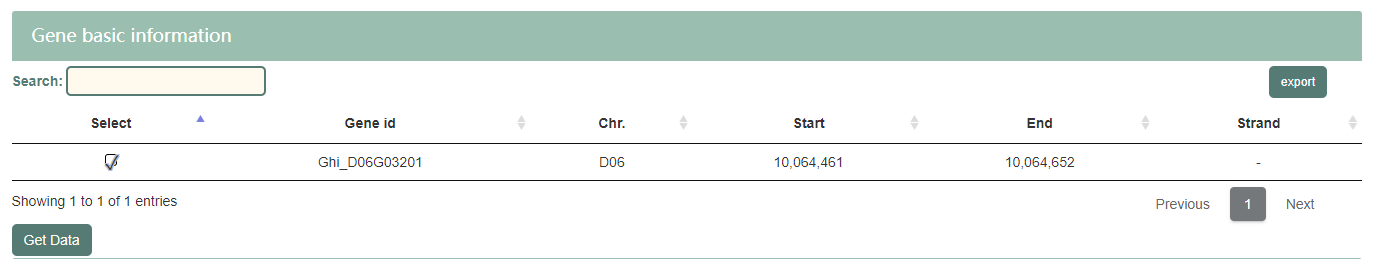
We demonstrate the search results with the Ghi_D06G03201 gene. After entering "Ghi_D06G03201" in search bar, the result page will shown in minute. The result page compromise 4 parts. Tables in the result page are downloadable by click the button locate in the upper right hand corner.
Part 1: Table of target genes and their basic information. User can choose one gene for further analysis.
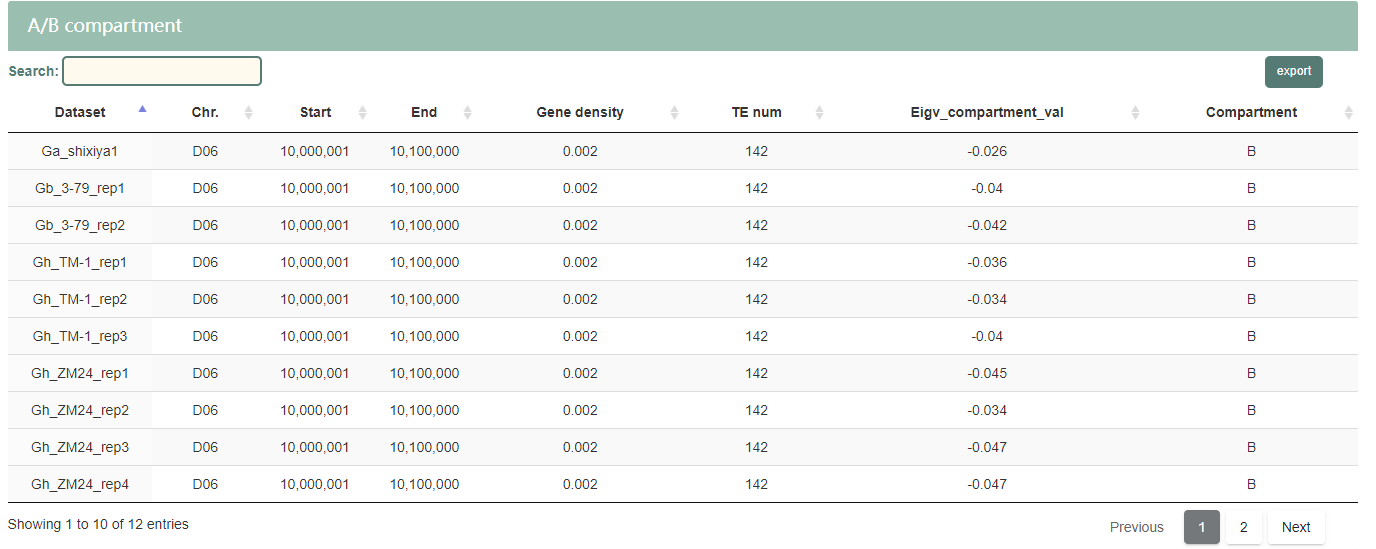
Part 2: Table showing the detail information of the compartment on the selected gene region.
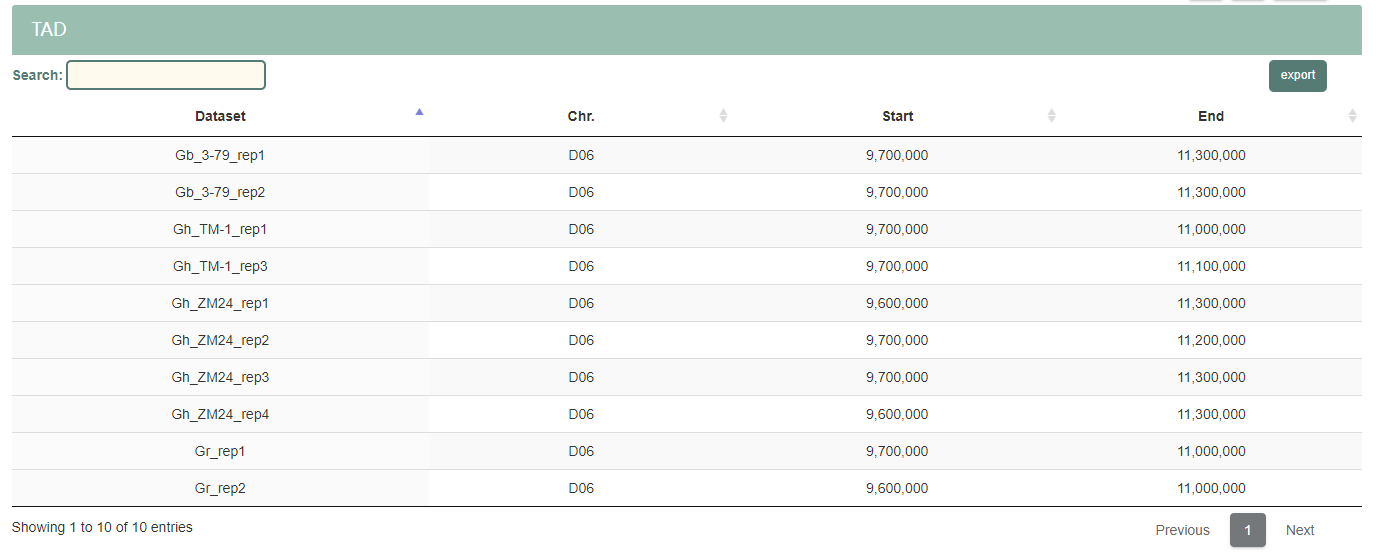
Part 3: Table showing the detail information of the TAD on the selected gene region.
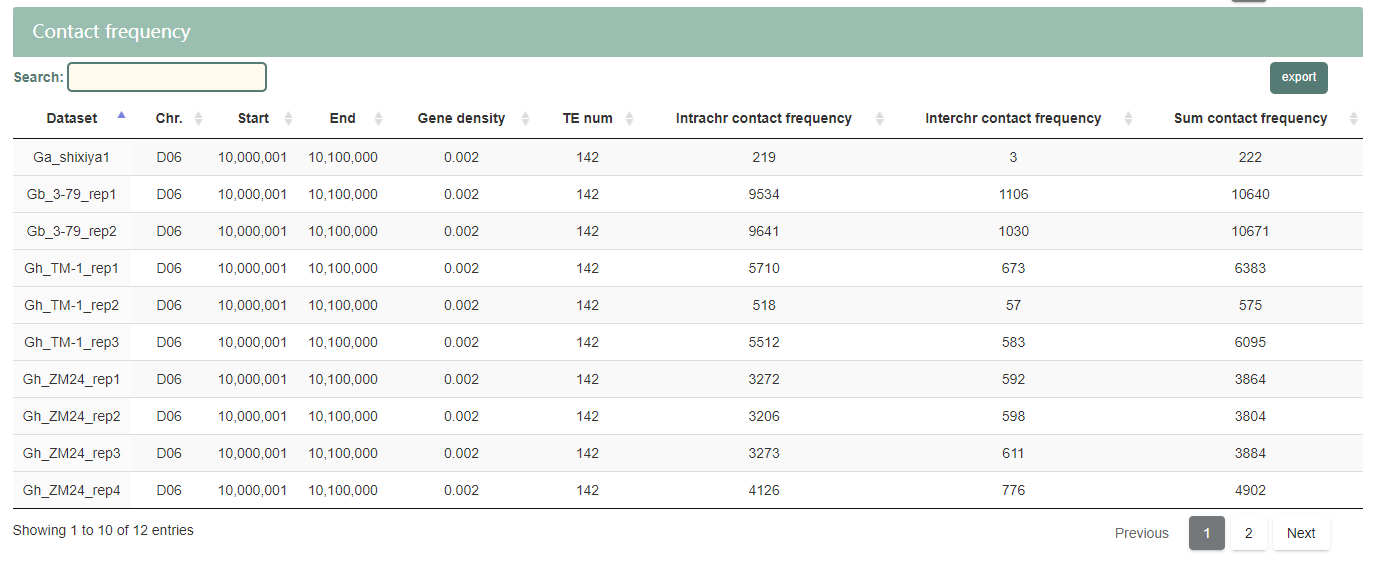
Part 4: Table showing the detail information of the contact frequency on the selected gene region.
6.2 Chromatin accessibility
6.2.1 Input
Input mode 1: Search based on conditions such as the genomic region, peak length, pileup, and fold enrichment.
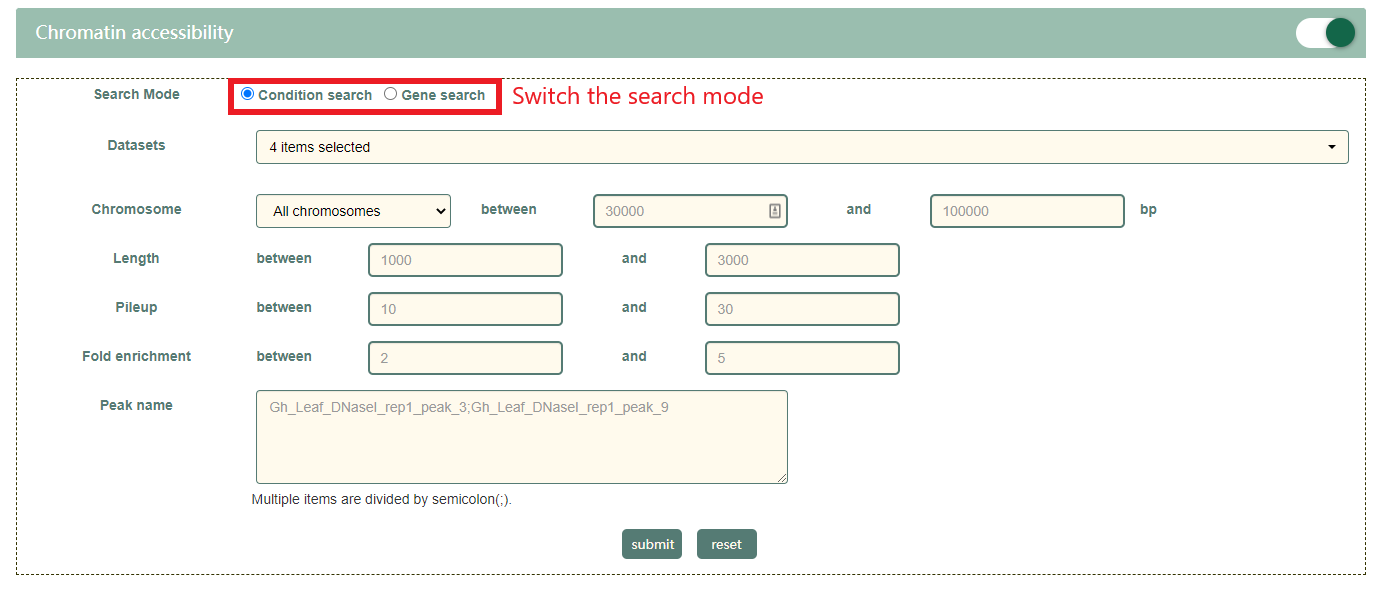
Input mode 2: Search based on the gene index or gene list and the upstream and downstream of the gene.

6.2.2 Result page
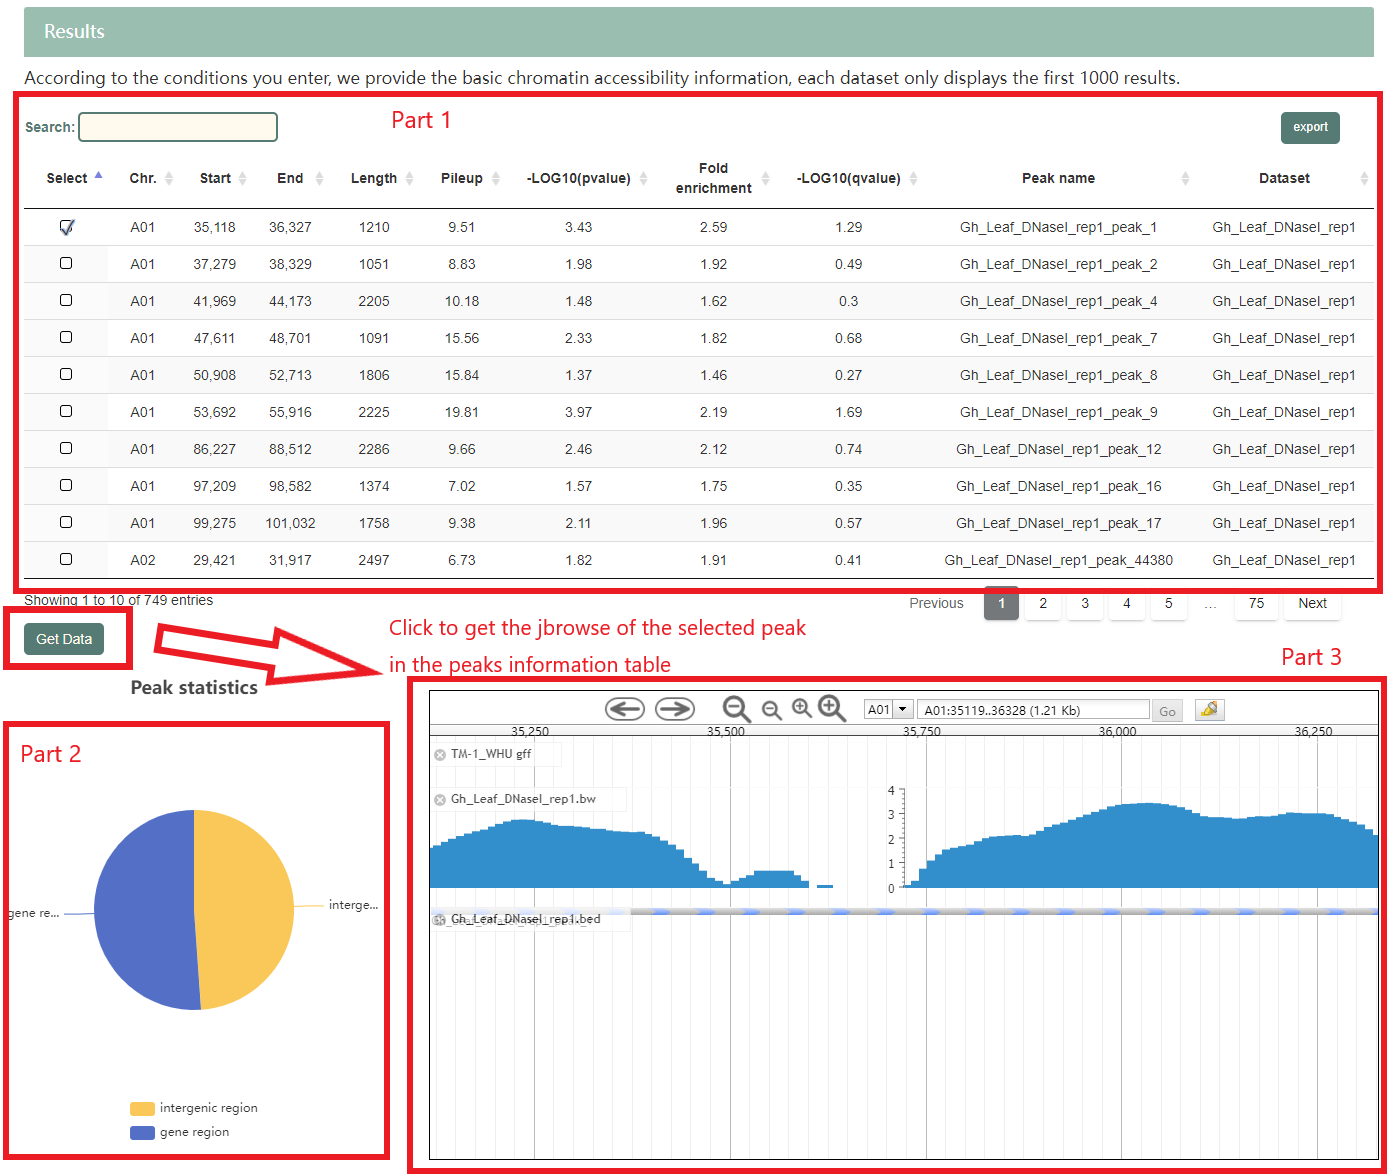
Result of condition search: After entering "30000" and "10000" in chromosome form item, "1000" and "3000" in length form item, the result page will show in minute. The result page compromise 3 parts.
Part 1: Table of chromatin accessibility information.
Part 2: The ratio of the number of peaks in the gene region and the intergenic region among all the peaks.
Part 3: The jbrowse visualization of the selected peak in the table.
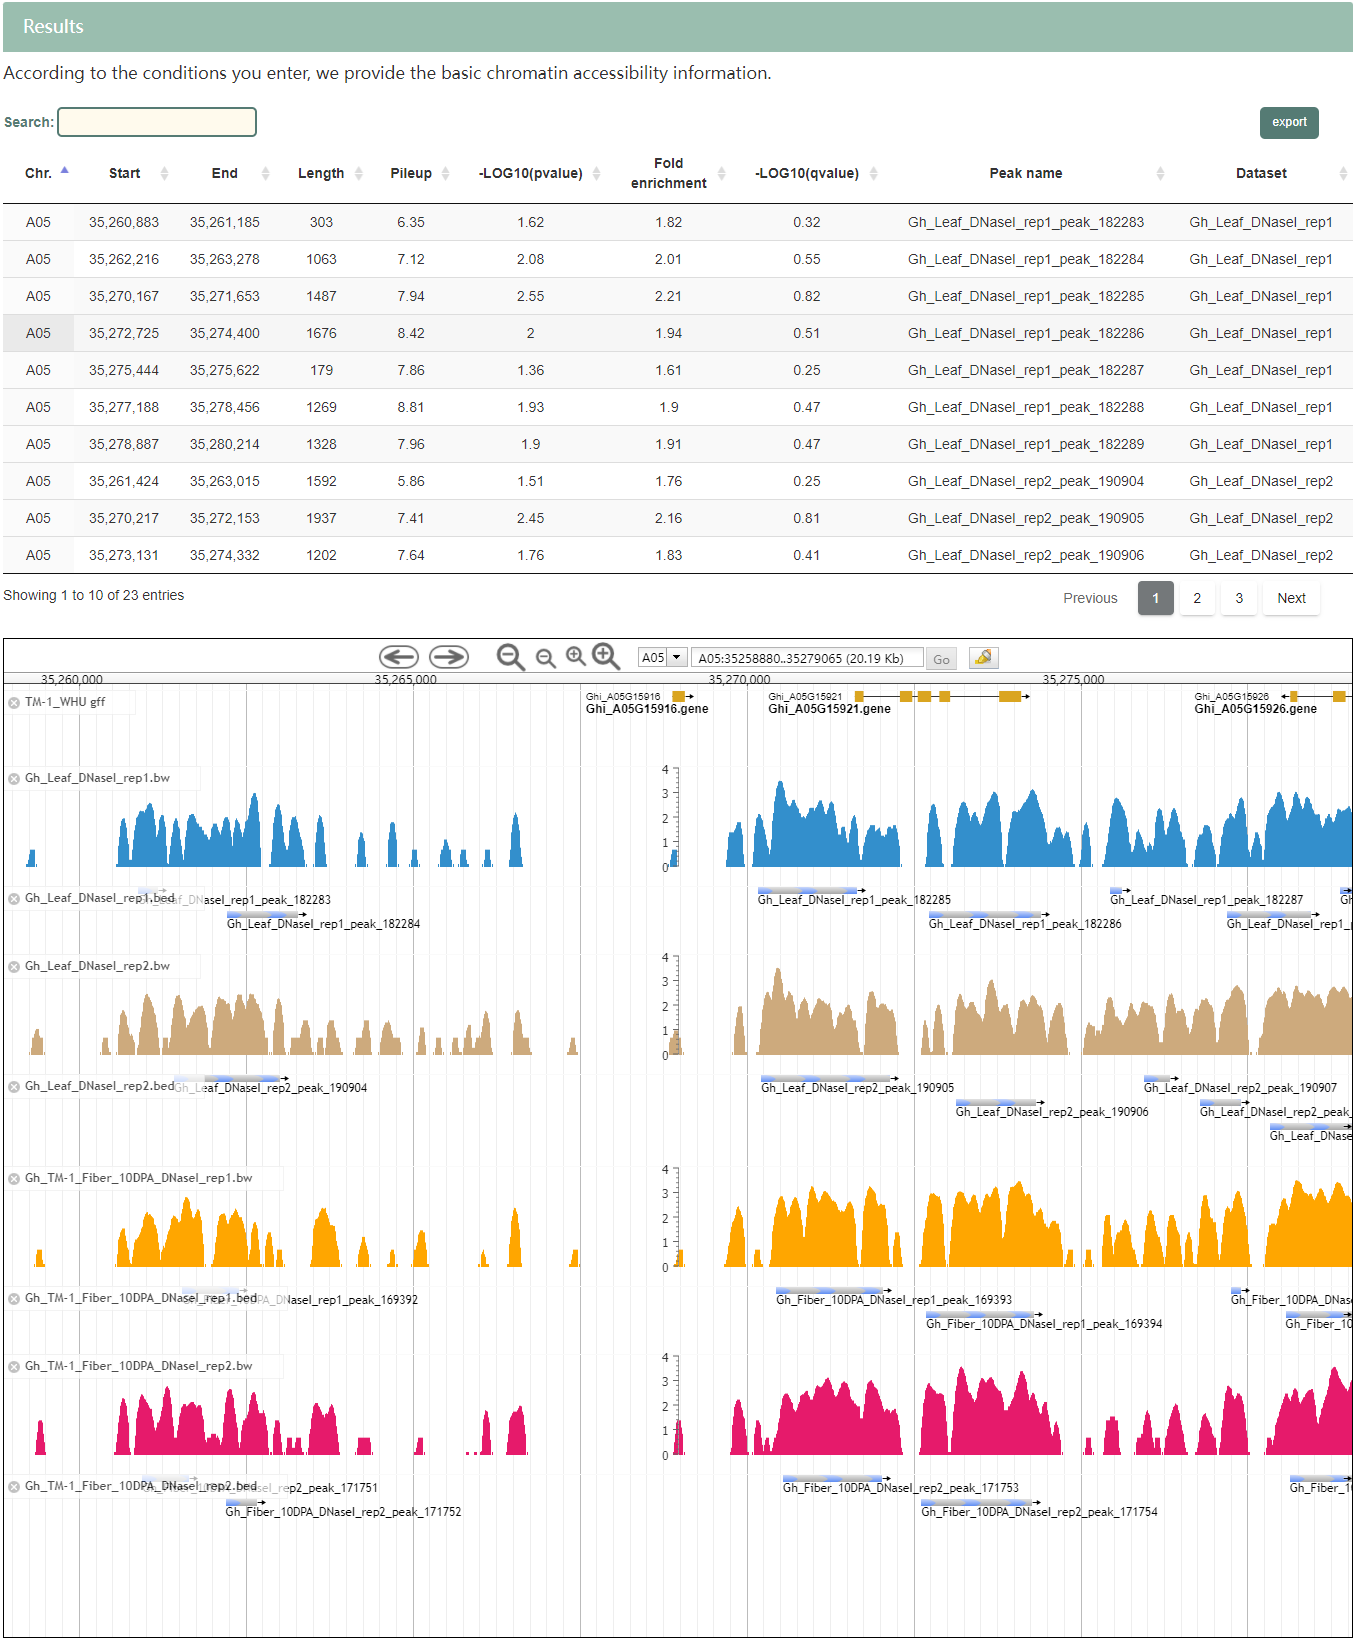
Result of gene search: After entering "AT2G40190" and choose "10kb" in search bar, theresult page will shown in minute. The first is the gene information table. User can choose one gene in the table for further analysis.
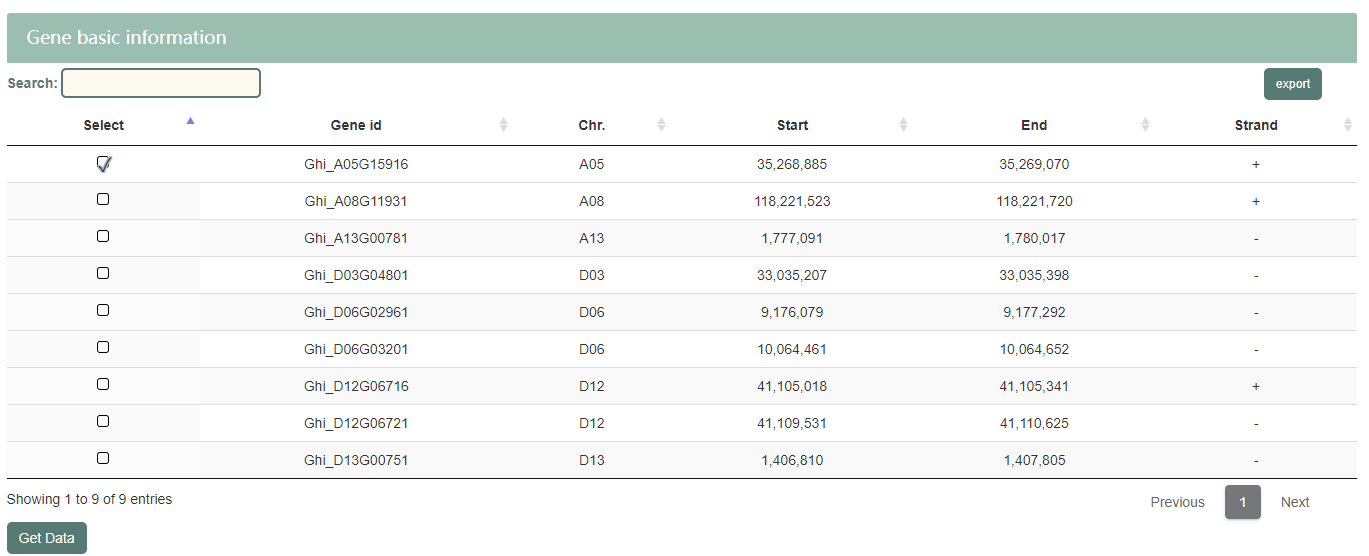
After the first gene is selected by default, the result contains table of chromatin accessibility information and jbrowse visualization.
6.3 Histone modification
The instructions for the histone modification page are similar to the chromatin accessibility page.
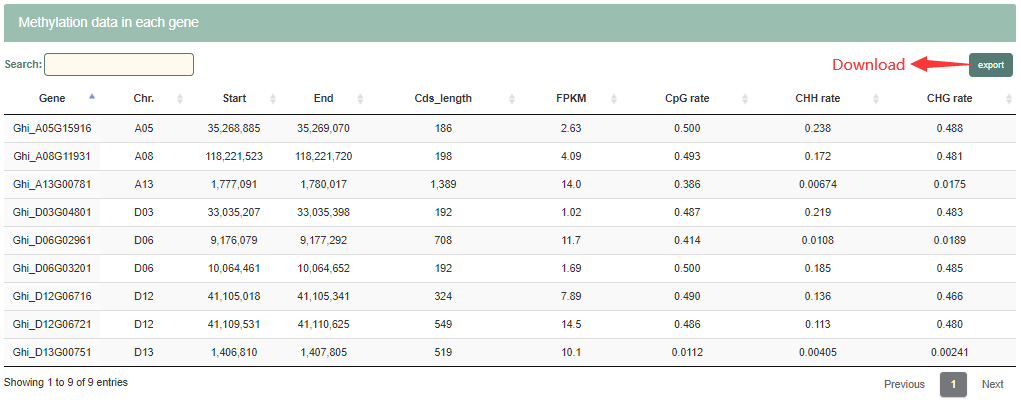
6.4 DNA methylation
We collected eight kinds of histone modification datasets from 6 germplasms from 5 published datasets, including H3K4me1, H3K4me3, H3K9me2, H3K27me3, H3K9ac, PolII, CENH3 and CH2. Clean reads from all histone modification datasets were mapped to TM-1 reference genome using Bowtie (version 1.2.0). PCR duplicated reads were removed using Picard tools (version 2.19). Peaks were called using callpeak module of MACS2 software (version 2.1.2) with parameters "--nomodel -q 0.05 --extsize 200 --shift -100 -g 8.84e8 --keep-dup all -B --call-summit". Users can browse histone modification tracks of all accessions in Jbrowser. User can search histone modification peaks of all accessions in histone modification module by inputting the gene id of interested gene or interested genomic region.
7. Multi-omics module
Multi-omics is function module integrating multiple omics datasets. It is constructed based on association analysis, such genome-wide association study (GWAS), eQTL, transciptome-wide association study (TWAS) and fine-mapping methods of causal variations, such as colocation analysis and SMR (Summary databased Mendelian randomization analysis).
7.1 GWAS
Genome-wide association study is an approach for identifying the genes that underlie common diseases and related quantitative traits. This strategy combines a comprehensive and unbiased survey of the genome with the power to detect common alleles with modest phenotypic effects. In CottonMD, we collected 9 traits of 4,180 cotton accessions, including Fiber elongation rate (FE), Fiber length (FL), Fiber strength (FS), Fiber uniformity (FU), Flowering day (FD), Short fiber rate (FR), Leaf pubescence amount (LPA), Micronaire value (MV), Verticillium wilt disease index (DI) and performed GWAS combining their genotypes using GEMMA. The most significant SNP in every 500kb-window was retained. User can browse GWAS results and search significant SNPs and genes of 6 fiber-associated traits.
7.1.1 Input
Gene ID: gene ID of TM-1_WHU reference. Define the upstream and downstream of the target gene.
Gene region: genomic region of TM-1_WHU genome in a format of "chr:start..end". Trait: Choose the traits you are interested in.

7.1.2 Result page
The result page provides global Manhattan plot and query of significance of the local region or gene.
Part 1: Manhattan plot of the genome. Users can zoom in and out the plot by scrolling the mouse. Users can also mouse over the bar to get the information of the region, including genome location, -lg(p value), variation ID.
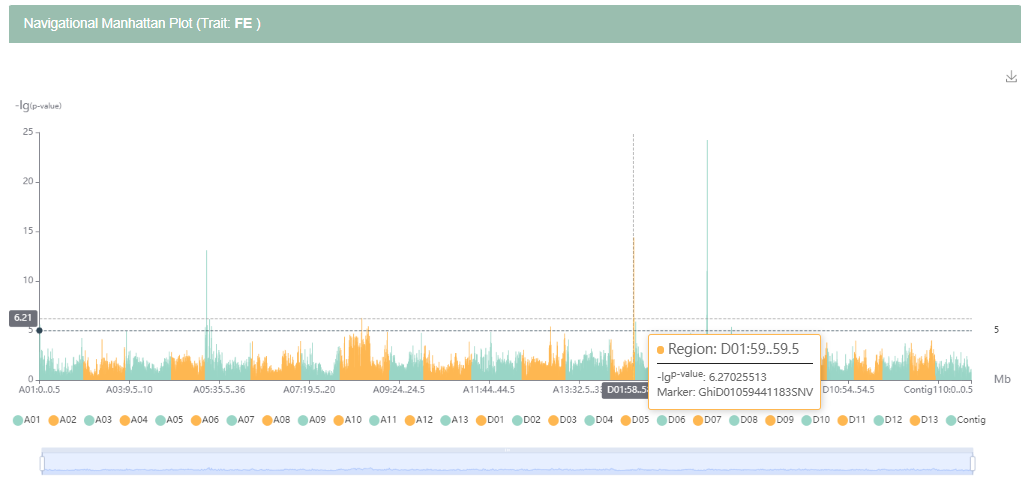
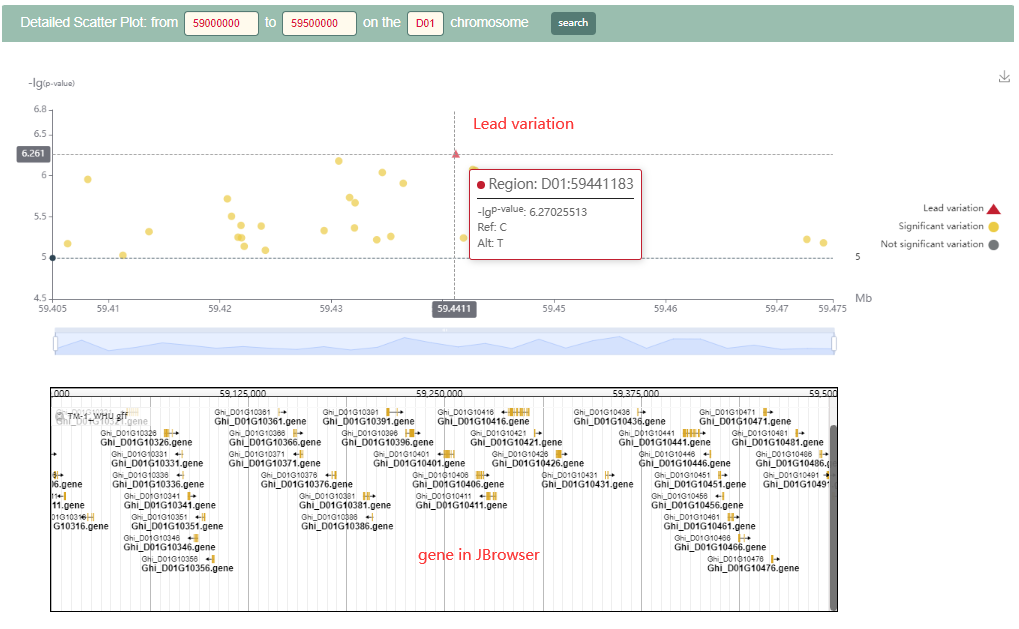
Part 2: Local Manhattan plot. Users can check specific genomic region by entering genomic region in the search bar at the top. Top: scatter plot the significant variations. Lead variations are indicated by red triangle. Bottom: JBrowser of the genome and genes. Users can mouse over these interactive plots to get the corresponding information.
7.2 eQTL
7.2.1 Input
Gene index: gene ID of 25 published cotton genomes.
SNP region: genomic region of TM-1_WHU genome in a format of "chr:start..end".
Gene list: gene ID of TM-1_WHU reference.

7.2.2 Result page
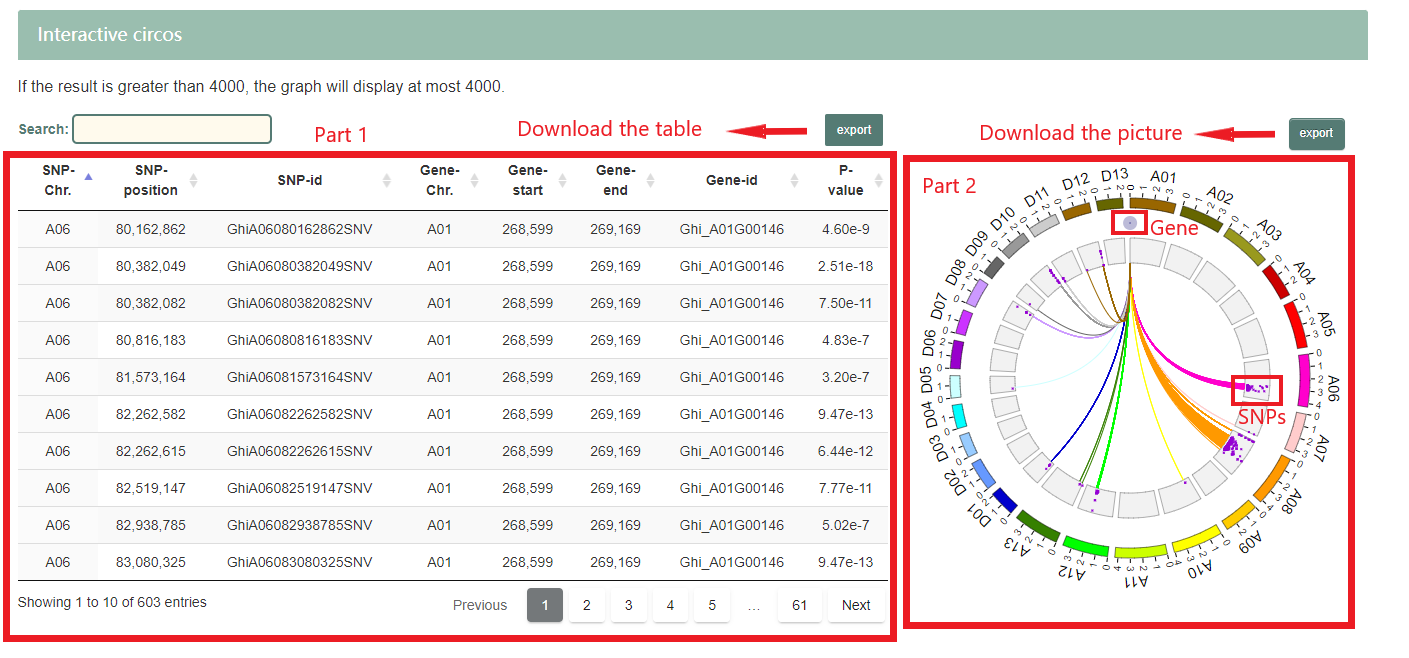
We demonstrate the search results with the Ghi_A01G00146 gene. After entering "Ghi_A01G00146" in search bar, the result page will shown in minute. The result page compromise 2 parts. Figures and tables in the result page are interactive and downloadable by click the button locate in the upper right hand corner.
Part 1: Table showing the detail information of the eQTL.
Part 2: The visualization chart of eQTL.
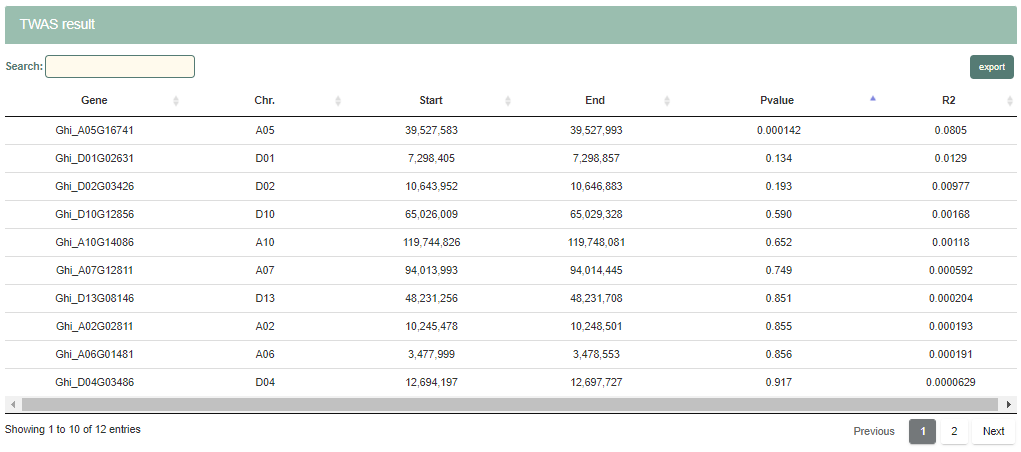
7.3 TWAS
Transcriptome-wide association studies (TWAS) have been widely used to integrate gene expression and genetic data to identify gene–trait associations. In CottonMD, we collected RNA-seq data of fibres at 15 DPA (day post anthesis) and 6 fiber-associated traits from 251 Upland cotton accessions and performed TWAS using mixed-linear module (MLM). User can browse the links between phenotypes and genes by inputting the interested genes.
7.4 COLOC
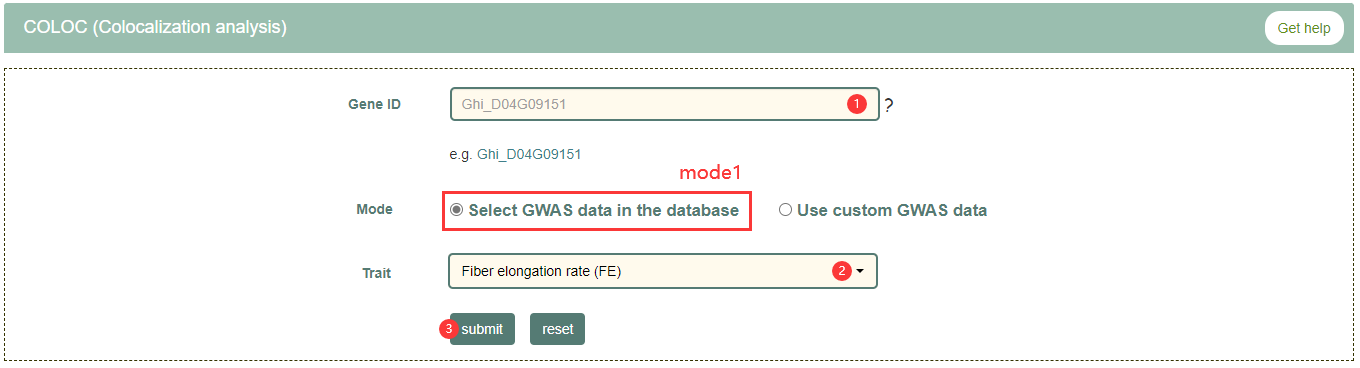
Colocalization analyses (COLOC) assess the degree to which independent signals of association, including eQTL and GWAS signals, share the same causal variant. In cottonMD, user can make full use of RNA-seq data in cottonMD to perform colocalization analyses by select phenotype datasets in database. Colocalization analyses in cottonMD was performed using COLOC R package.
7.4.1 Input
Step1: Enter the genes on the TM-1_WHU genome you are interested in.
Step2: Select GWAS data in the database.
Step3: Get search results.
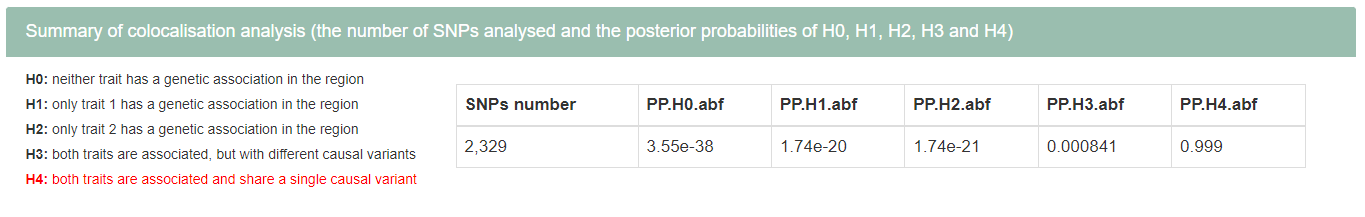
7.4.2 Summary of colocalisation analysis
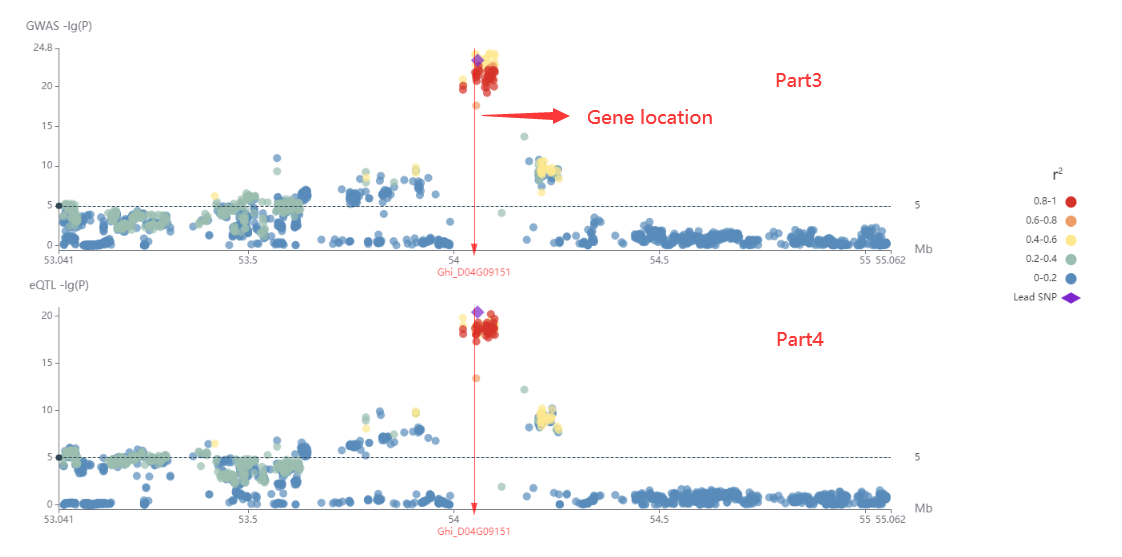
7.4.3 Colocalisation analysis result
Part1: Table showing the results of GWAS, eQTL and colocalization analysis. The row in red font represents the significant result of the colocalization analysis.
Part2: Visualization of colocalization analysis. Purple rhombus represent significant SNPs in colocalization analysis.

Part3: Visualization of GWAS results. The purple rhombus represents lead variation.
Part4: Visualization of eQTL results. The purple rhombus represents lead variation.
7.5 SMR
SMR (Summary data–based Mendelian randomization analysis) is an method based on multi-omics, which integrates summary-level data from GWAS with data from expression quantitative trait locus (eQTL) studies to identify genes whose expression levels are associated with a complex trait because of pleiotropy.
7.5.1 Input
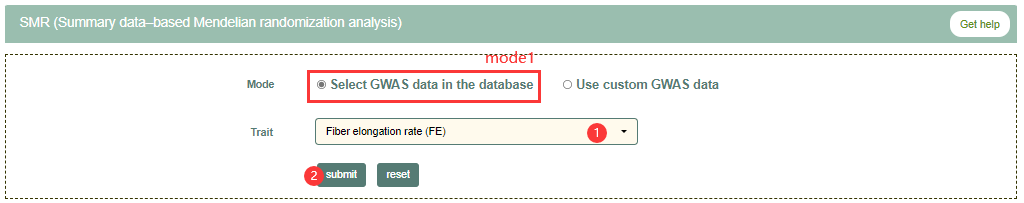
Input mode 1:
Step1: Select GWAS data in the database.
Step2: Get search results.
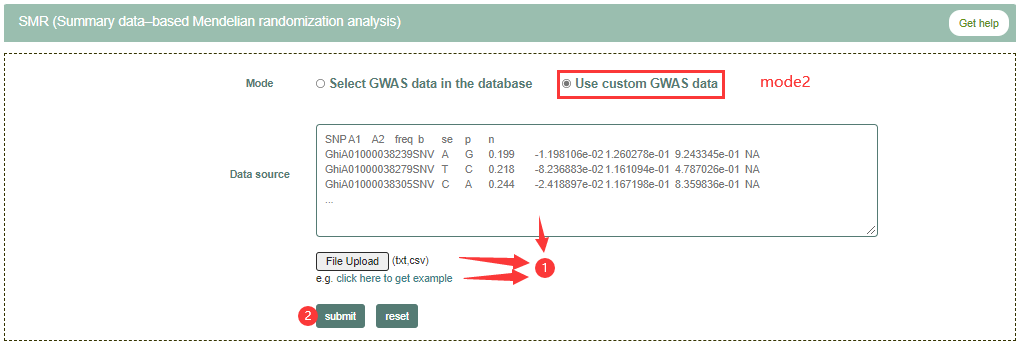
Input mode 2:
Step1: Enter, upload or use example GWAS data.
Step2: Get search results.
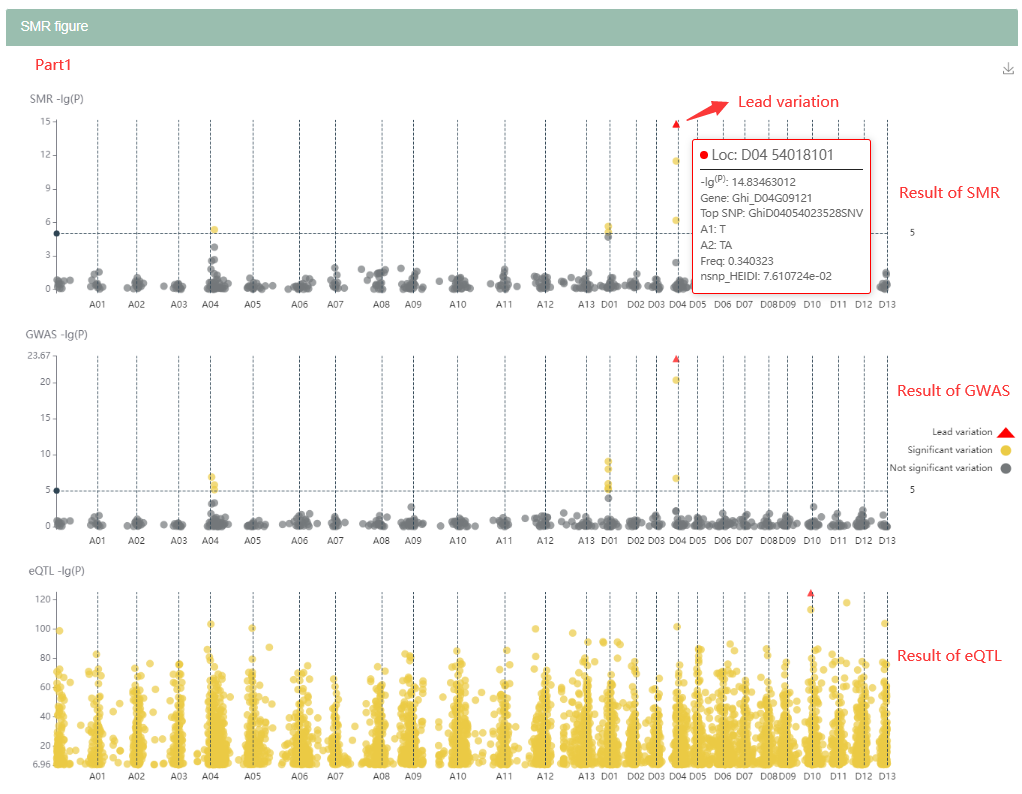
7.5.2 Result page
Part1: Visualization of SMR, gwas and eQTL results. The red triangle represents lead variation.
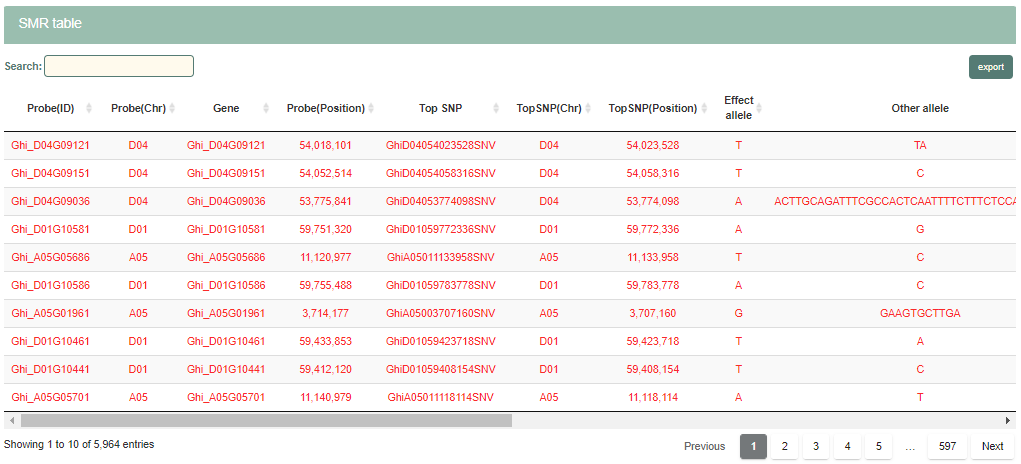
Part2: Details of SMR results. The row in red font represents the significant SMR P value. The row in red font represents the significant SMR result.
8. Metabolome module
We collected data on 768 metabolites from four tissues including nonembryogenic staged calli (NEC), primary embryogenic calli (PEC), initiation staged globular embryos (GE), Green Fiber (GF), and Green Fiber Dark (GFD). Differentially accumulated metabolites (DAMs) were defined as those exhibiting a fold change ≥ 2 or a fold change ≤ 0.5 and a variable importance in project (VIP) ≥ 1 between PEC versus NEC, GE versus PEC, GE versus NEC, or GF versus GFD (p < 0.05). In total, 156, 139, 159, and 236 DAMs were collected. User can get metabolite data or DAMs data by selecting the metabolite category.
The Metabolomics module contains two data sets collected from different articles. Take the first data set as an example.

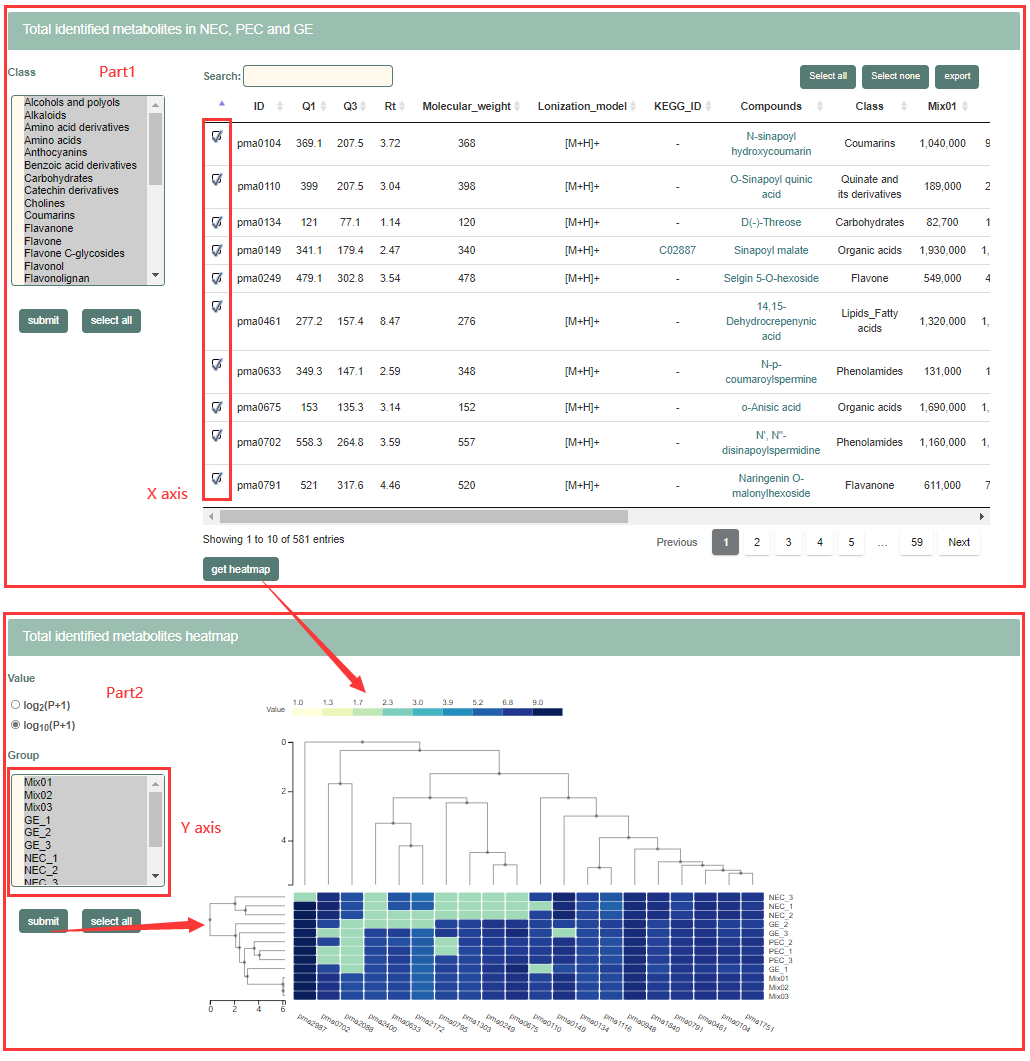
Part1: Total identified metabolites in NEC, PEC and GE. The table in this part shows the basic information of metabolites identified in each cotton tissue. Users can click on KEGG ID to link to KEGG, and click on the compound name to link to PubChem. Users can also filter metabolites through the form on the left.
Part2: Total identified metabolites heatmap. Users can control the X axis and Y axis of the heat map respectively by selecting the metabolites in part1 and the Group in part2.
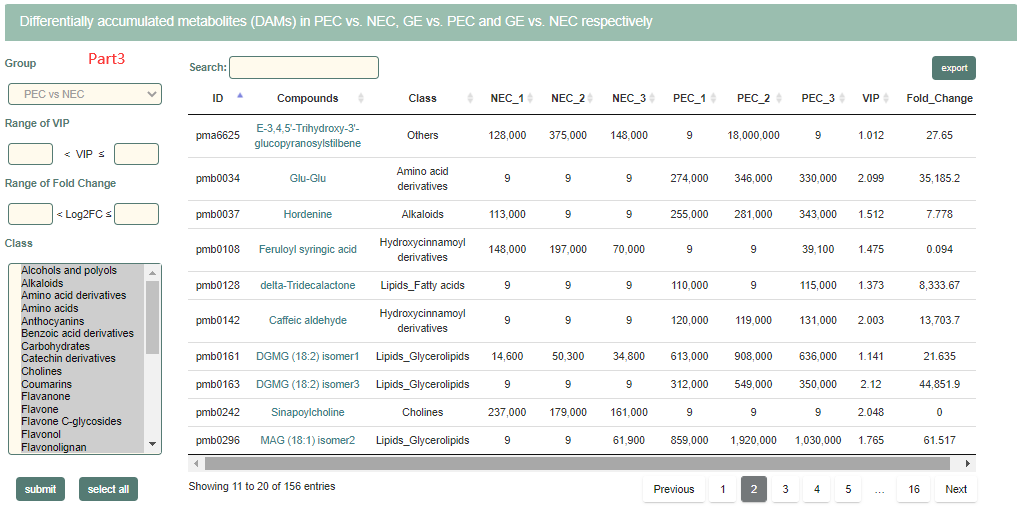
Part3: Differentially accumulated metabolites (DAMs) between two tissues. Users can select organization or filter metabolites through the form on the left.
9. Tools module
Some useful bioinformatic tools are provided in this module.
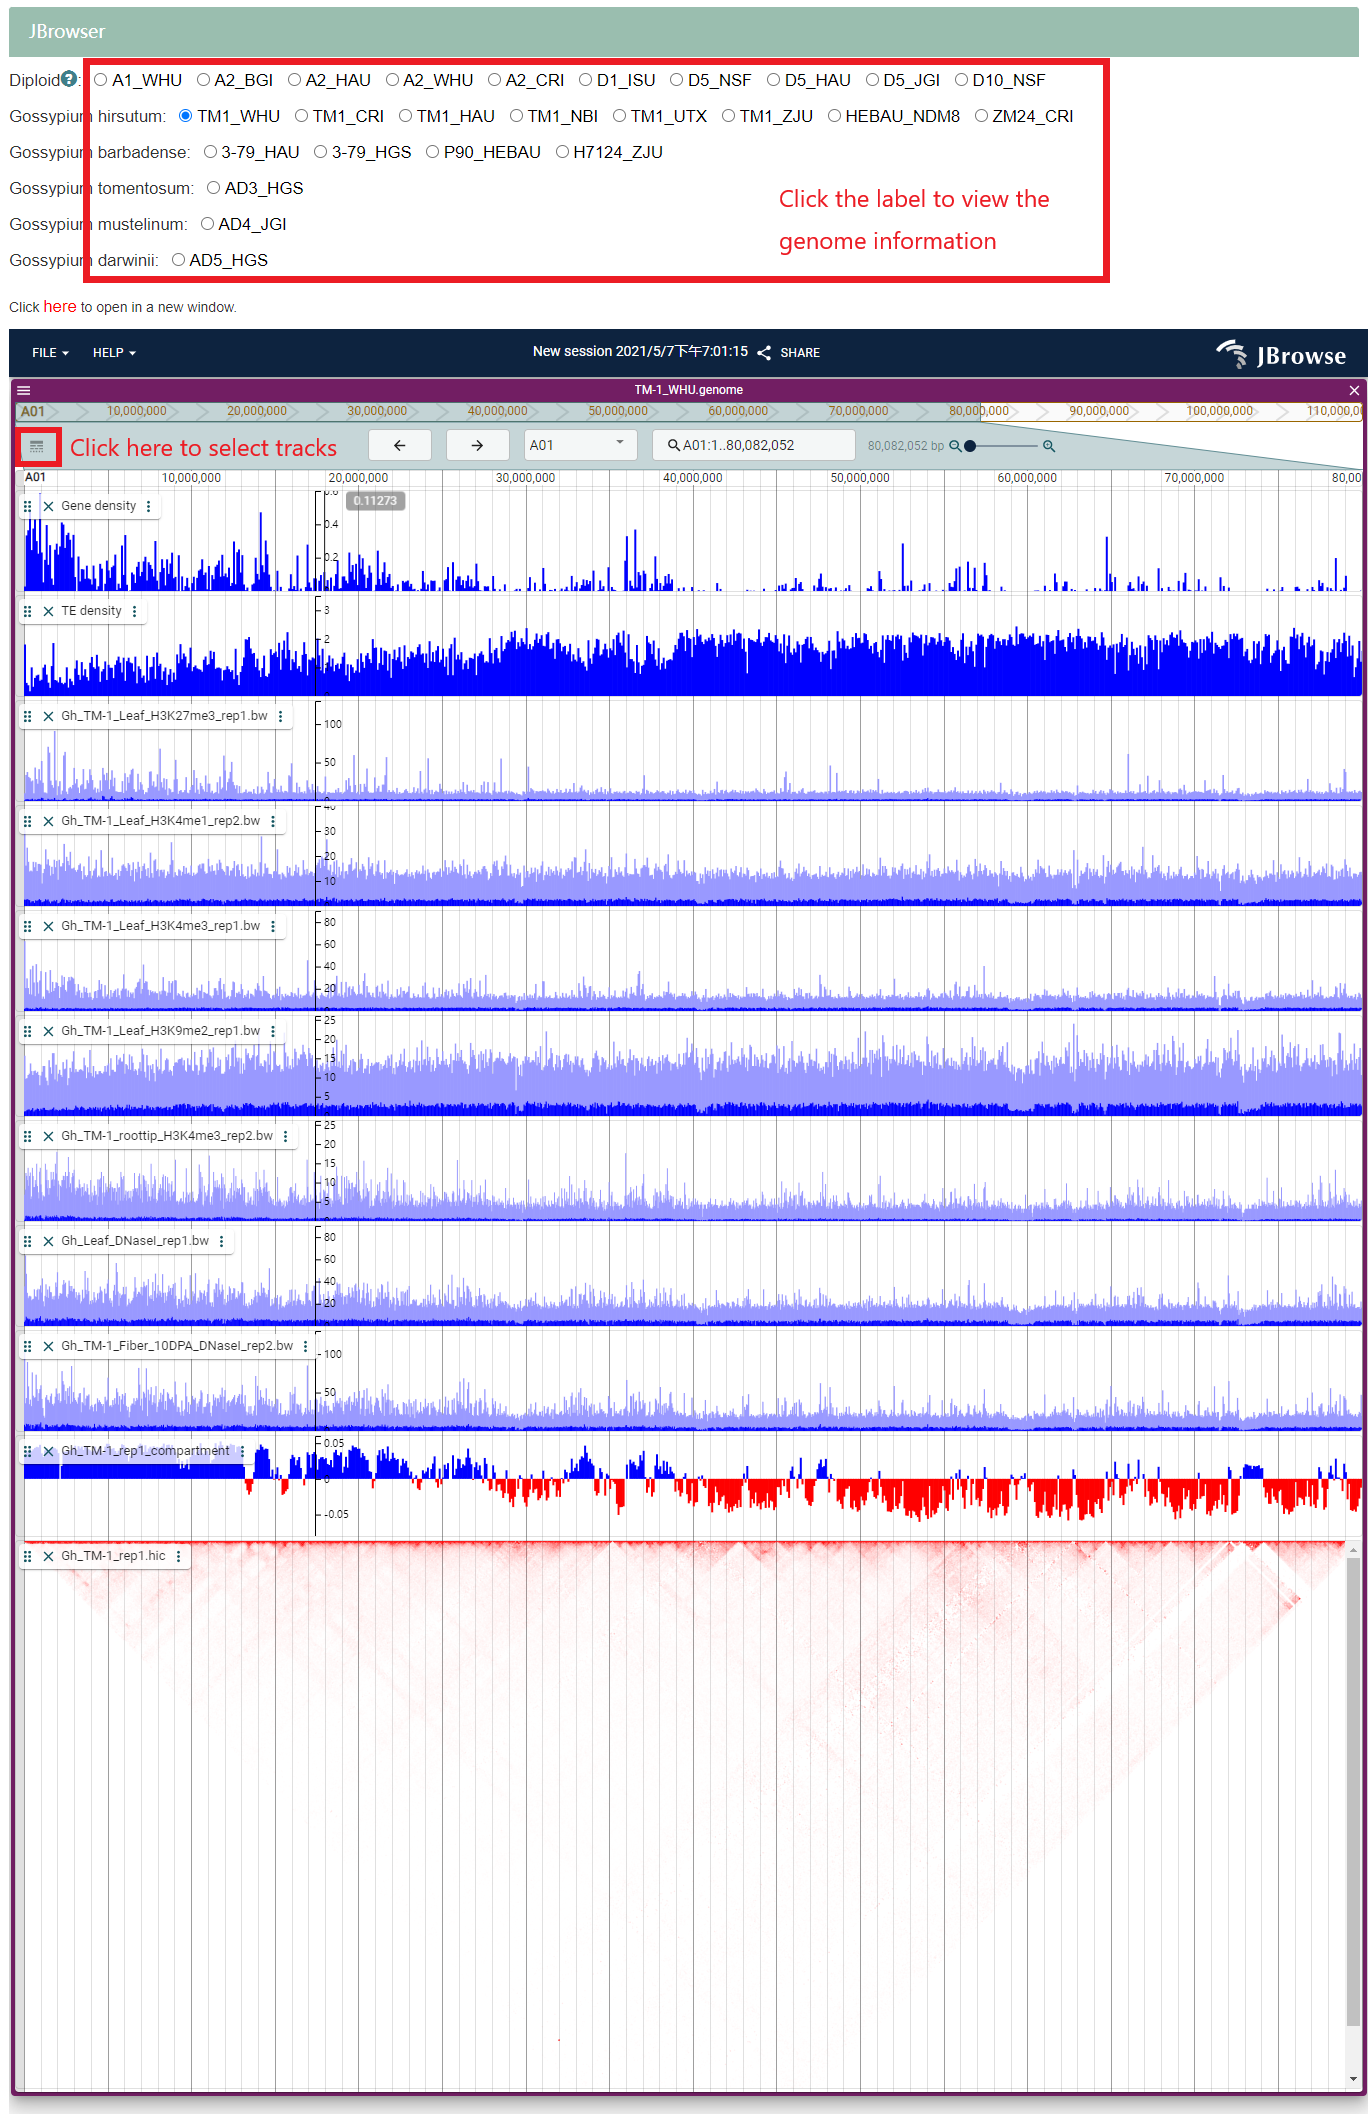
9.1 Jbrowse
This page enable users visualize gene features and epigenetics information in the TM-1_WHU genome, as well as the genome data and gene features of the remaining 24 genomes. The description of the 25 genomes can be viewed on the about page of the genomics module. The files in JBrowse can be downloaded in the download page.
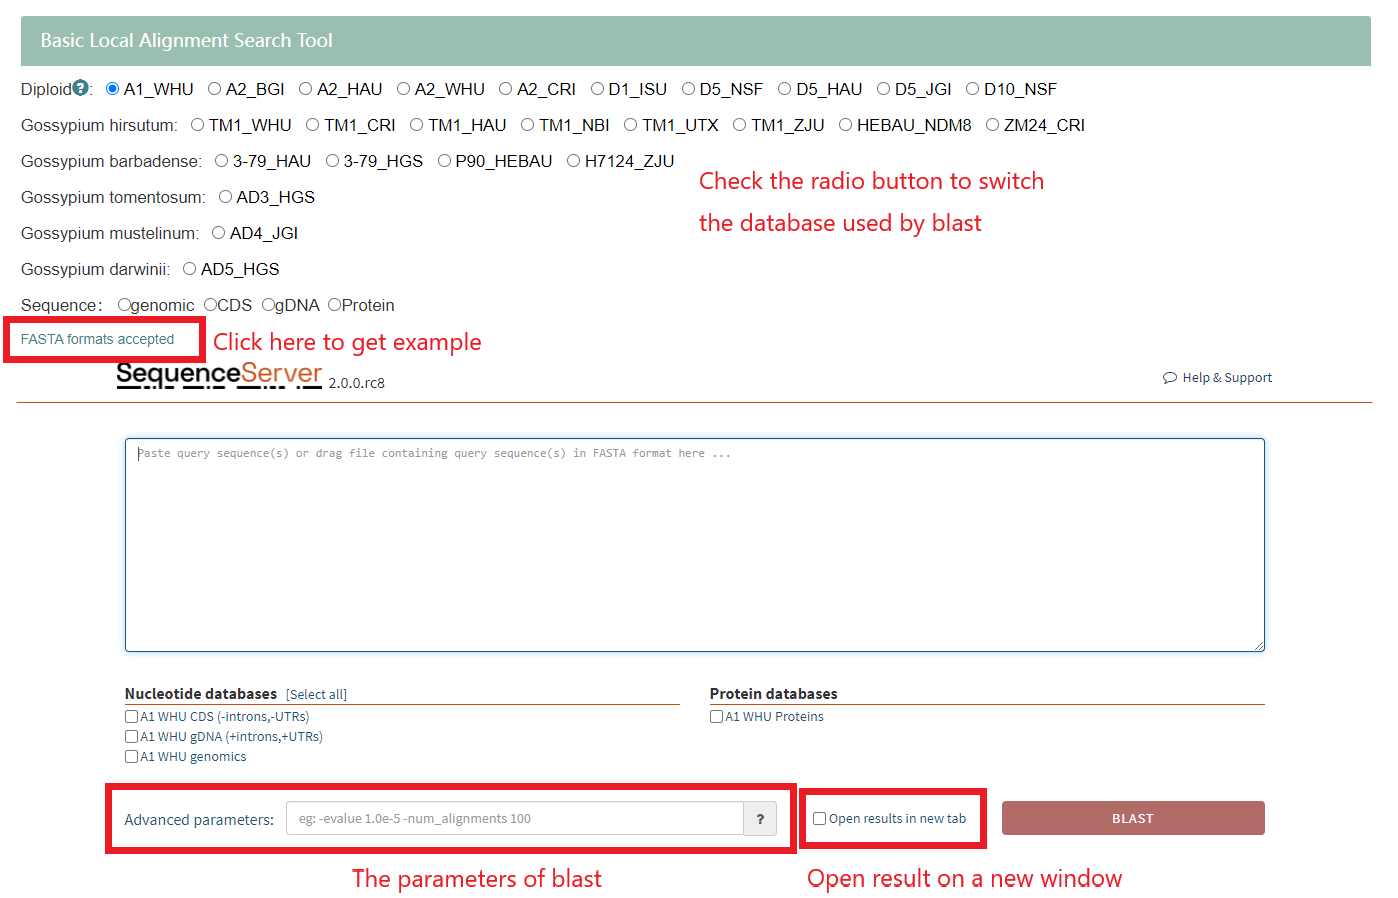
9.2 Blast
The blast database is constructed with the whole genome data, gDNA, CDS and proteins of 25 genomes. Users can input data in fasta format to view the visualized results of blast.
9.3 Seq fetch
Users can download sequence information by gene ID or genomic region on the seq fetch page.
9.3.1 Input

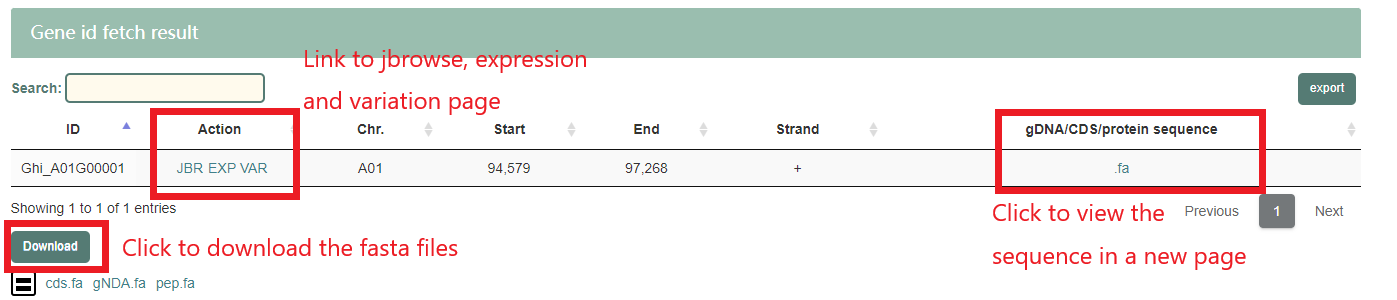
9.3.2 Result page
Gene ID search: After select the "TM1_WHU" and entering "Ghi_A01G00001" in the form, the result page will show in minute. The result is a gene information table, click the hyperlink to get sequence and more information.
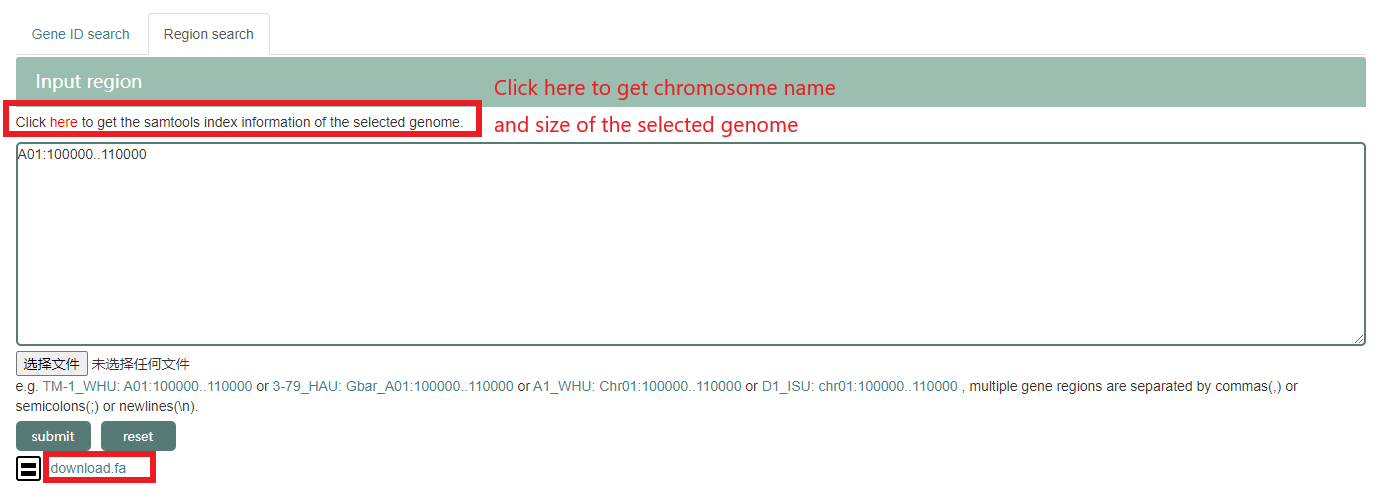
Genomic region search: After select the "TM1_WHU" and entering "A01:100000..110000" in the form, users can get the fasta file by click the download.fa.
9.4 Variation annotation
This page provides handy way for user to annotation the variation of their own with SnpEff based on TM-1_WHU genome.
9.4.1 Input
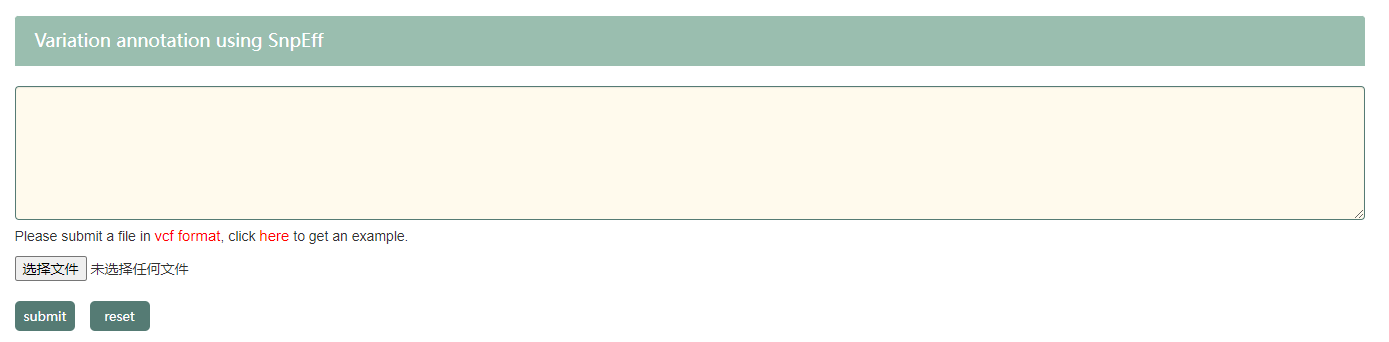
Users can upload vcf file of their own. Users can click "vcf Format" to know about the detail of vcf file. An example file is provided for test.
9.4.2 Result page
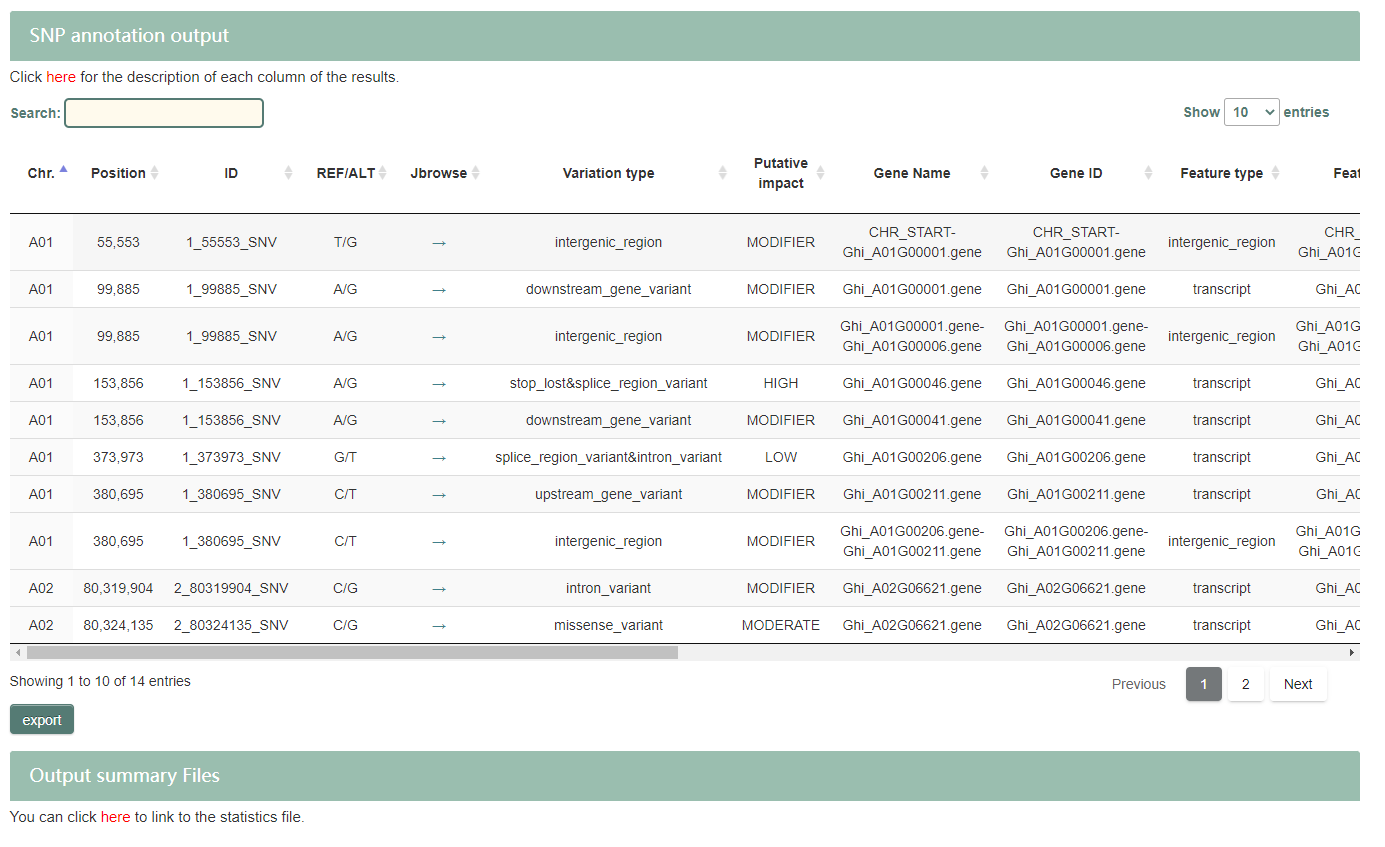
The result page contains the table of variation annotation information and a summary file provided by SnpEff. In addition, users can click on the hyperlink at the top of the table to get the description of each column in the table.
9.5 Heatmap
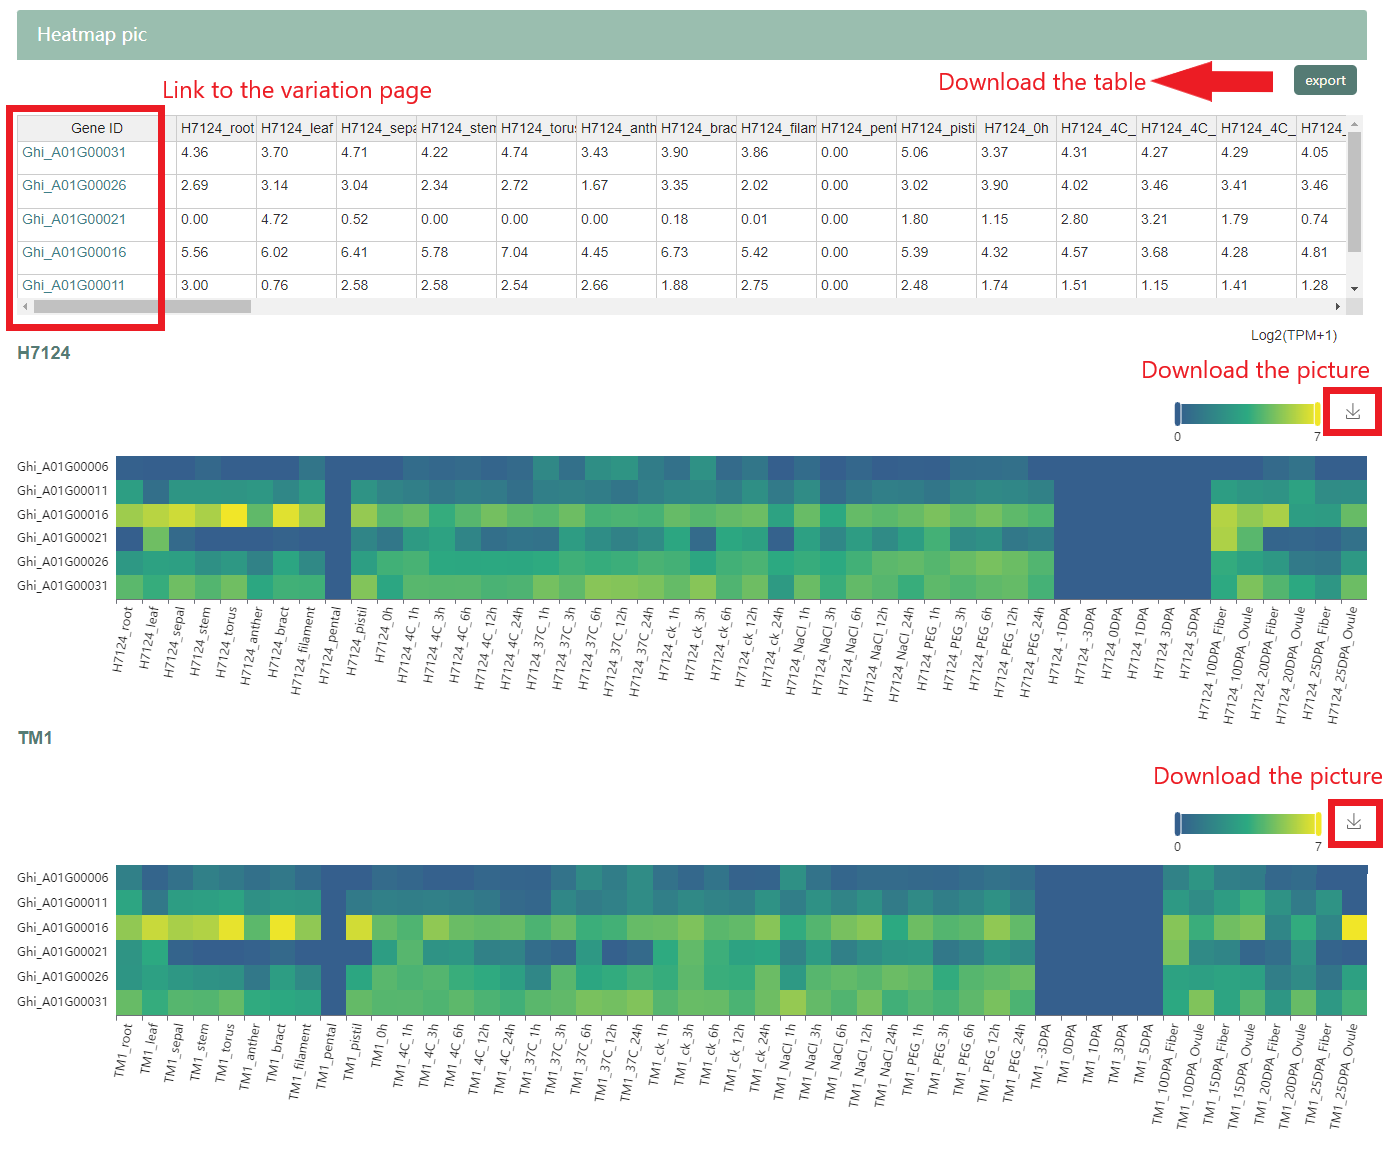
This page provides the gene expression heatmap of Hai7124 and TM-1_WHU in different tissues or treatment conditions. The tissues mainly come from root, stem, leaf, and various tissues in flowers. Environmental stresses mainly include low temperature stress, high temperature stress, drought stress and salt stress.
9.5.1 Input
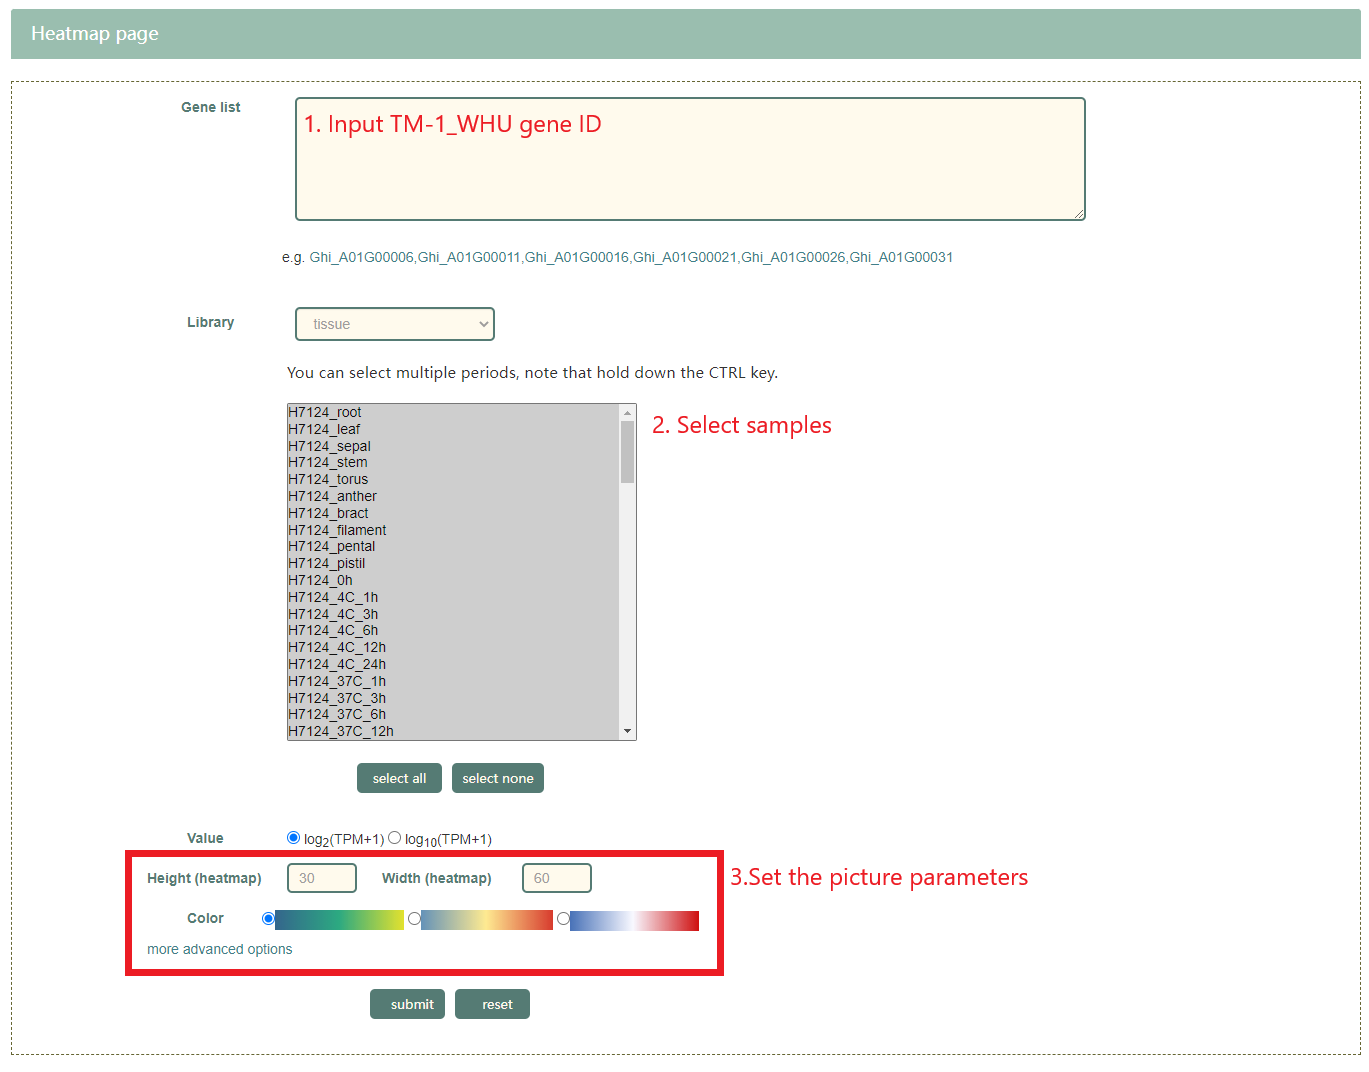
9.5.2 Result page
The result page contains the table of gene expression and two heatmap. The upper heatmap is from the Hai7124 , and the lower one is from TM-1_WHU.
9.6 GO/KEGG enrich
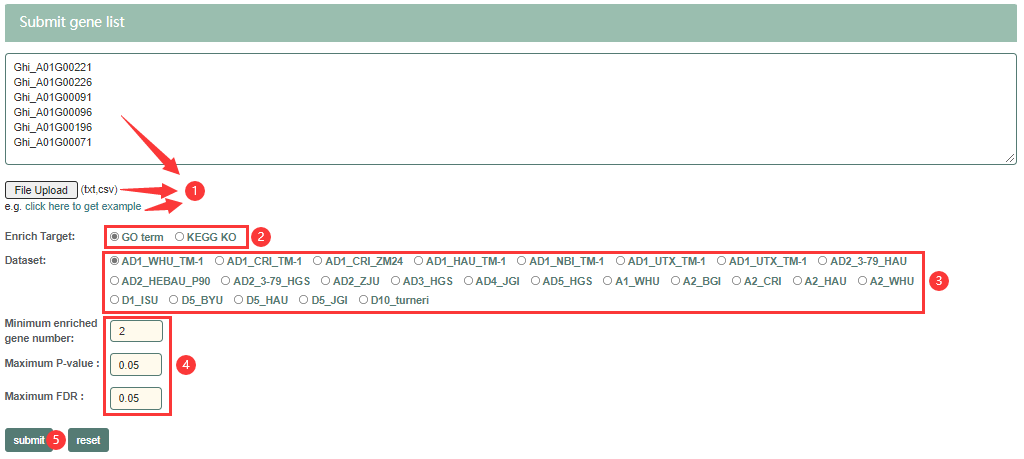
9.6.1 Input
Step1: Enter or upload the gene you are interested in. (Notice! The gene must match the genome of your choice)
Step2: Choose GO or KEGG analysis.
Step3: Select genome.
Step4: Filter data.
Step5: Get search results.
9.6.2 Result page
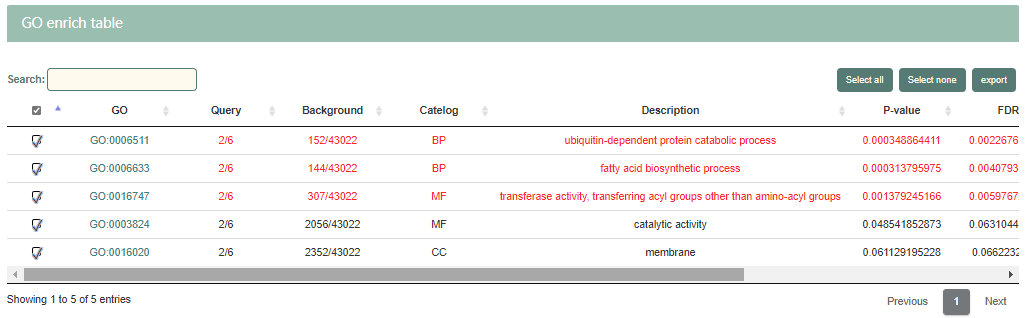
GO enrich table. The line with red text means that the result is significant. Users can click on the GO ID to jump to AmiGO.
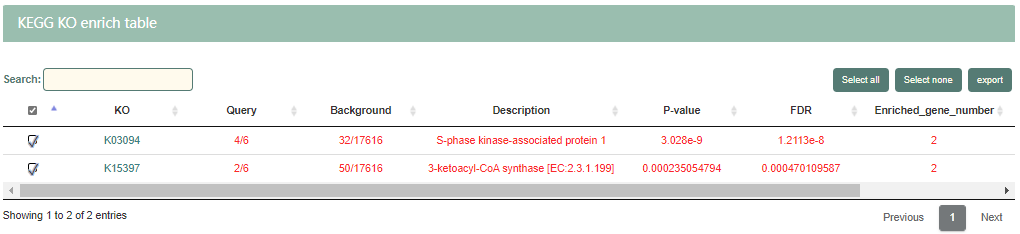
KEGG KO enrich table. The line with red text means that the result is significant. Users can click on the KO ID to jump to KEGG.
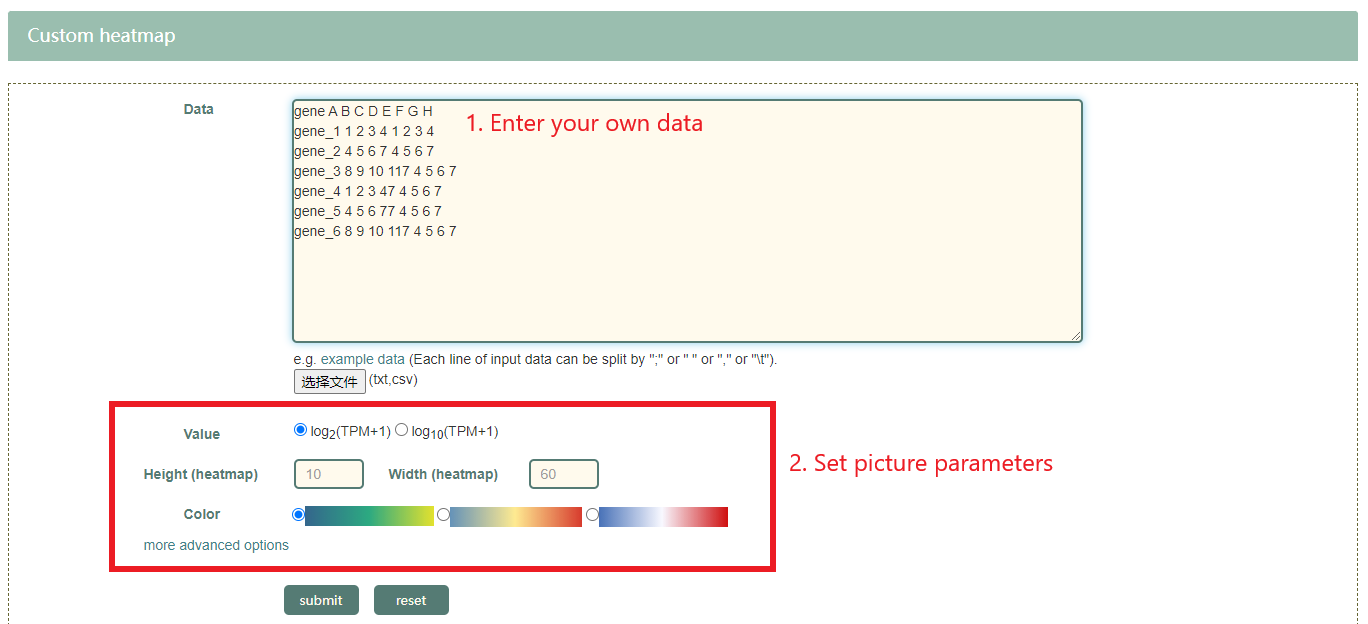
9.7 Data2heatmap
This function allows users to draw a heatmap for data of their own.
9.7.1 Input
Users can upload gene expression data of their own. Example data are provided for test.
9.7.2 Result page

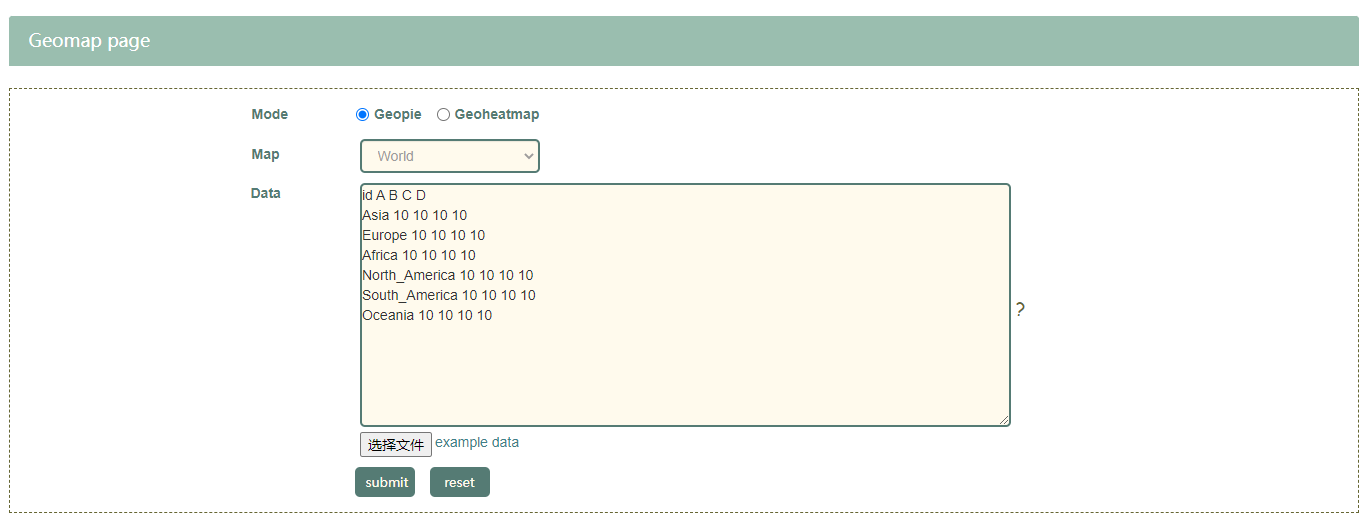
9.8 Data2geomap
This function allows users to draw a geomap for data of their own.
9.8.1 Input
Users can upload sample data of their own. Example data are provided for test. Map of the world, China, and US and two types of geomap, geopie and geoheatmap, can be chosen.
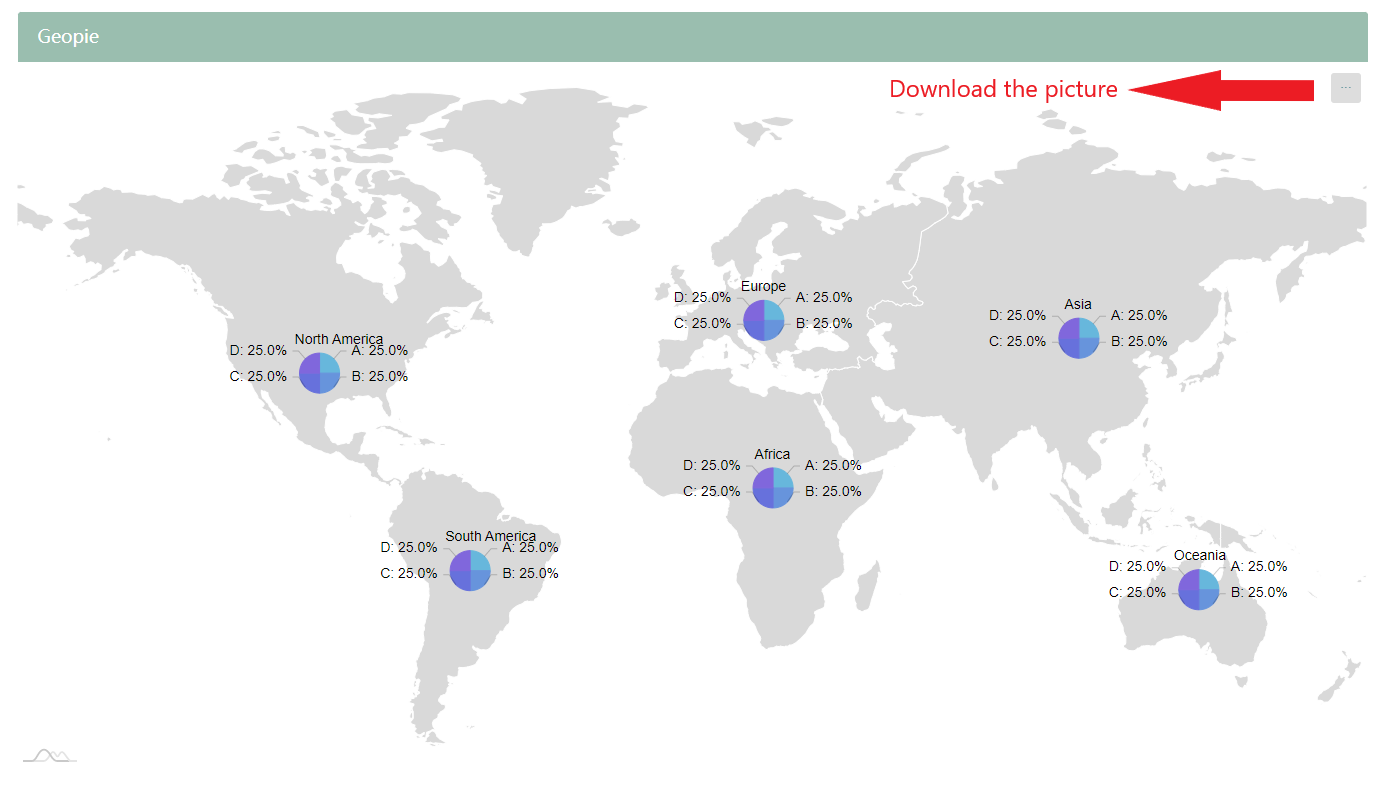
9.8.2 Output
Users can download the figure by click the button in the upper right corner.
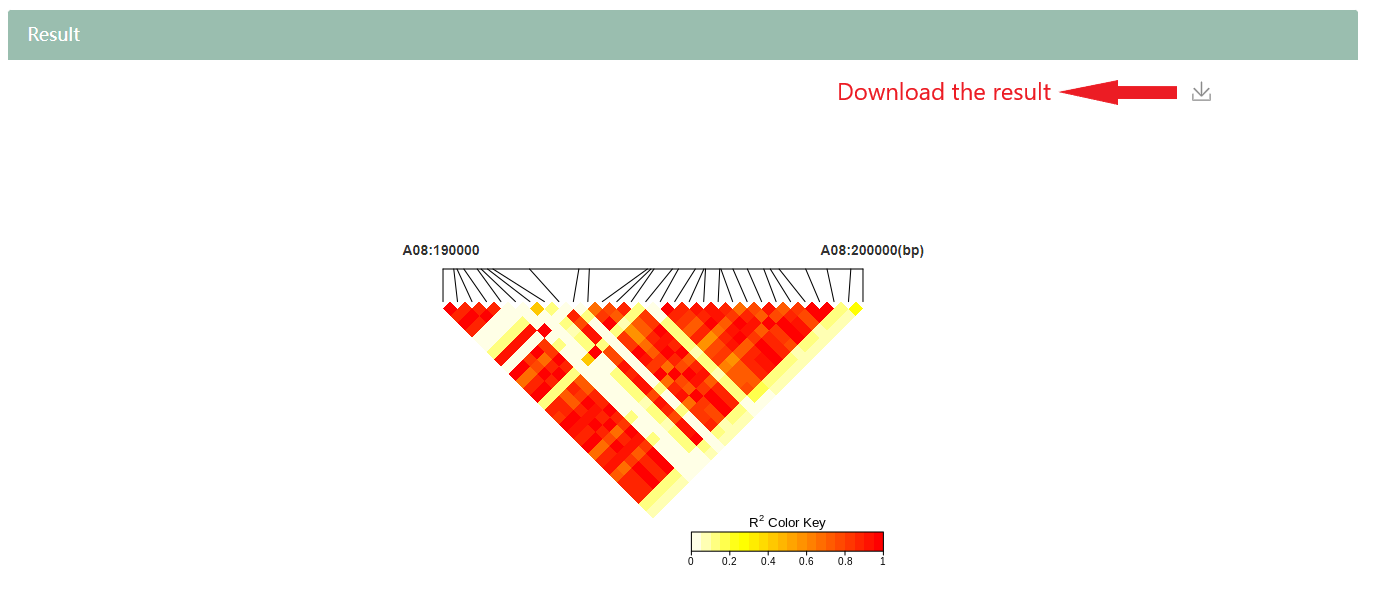
9.9 LD heatmap
Users can obtain a LD heatmap estimated from variation panel of based on TM-1_WHU genome in database for a specific genomic region.
9.9.1 Input
Enter the TM-1_WHU genomic region in the format of " chr:start..end ".

9.9.2 Output
Users can download the picture by clicking the button in the upper right corner in the result page.
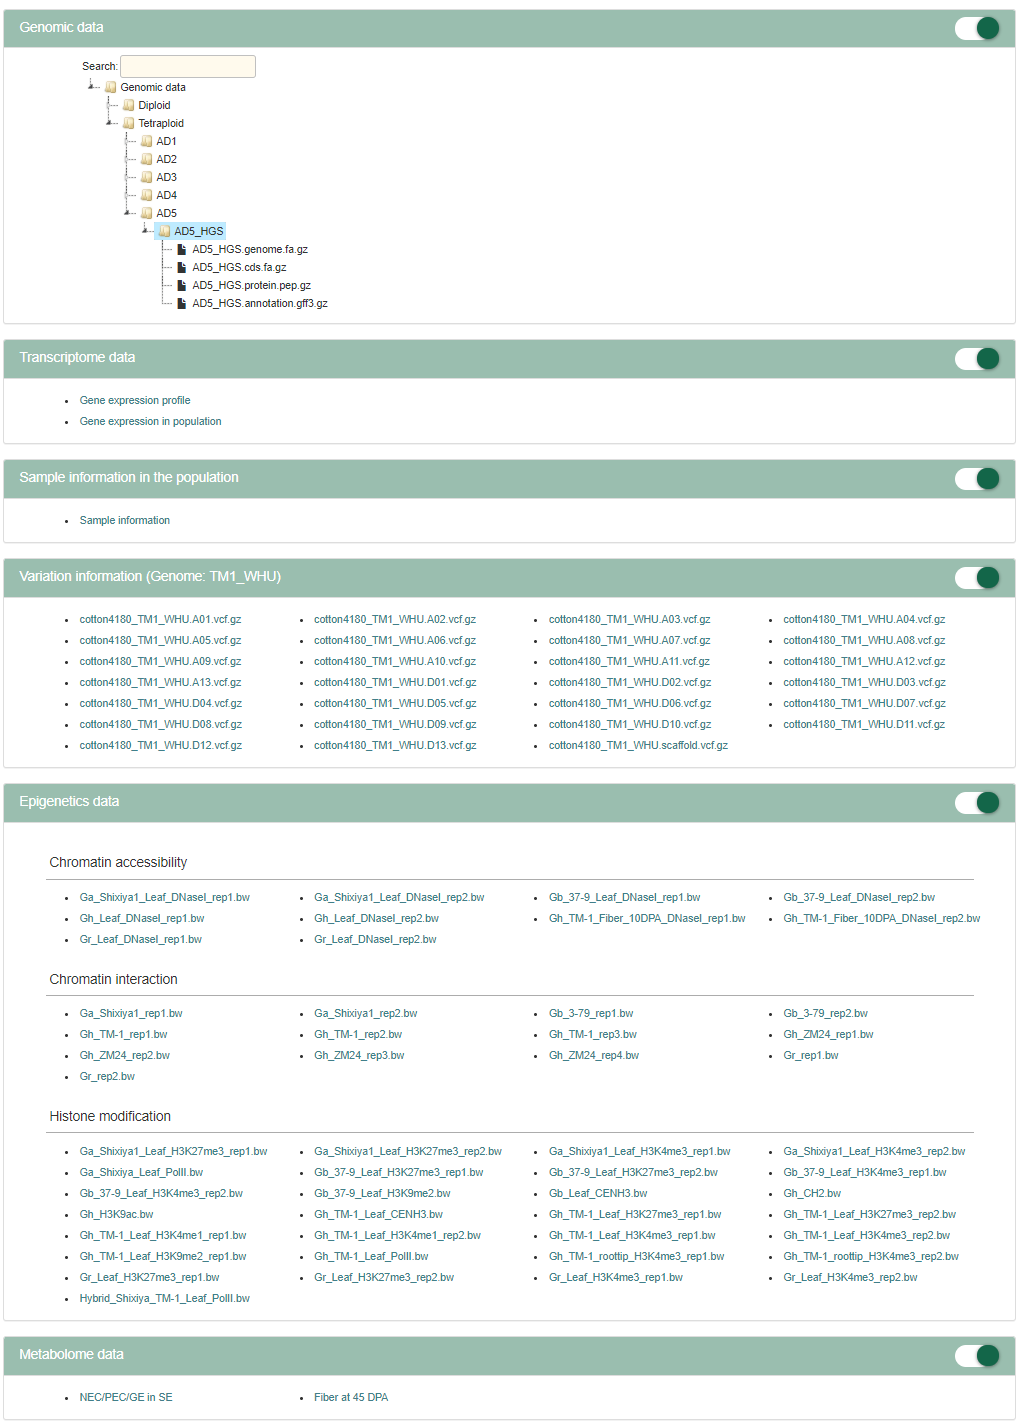
10. Download module
Genomic data, transcriptome data, sample information in the population, variation information, epigenetics data and metabolome data are available for download.
11. Help
Database tutorial, methods of data analysis and contact are available in Help.